Client Update Sept 28, 2020
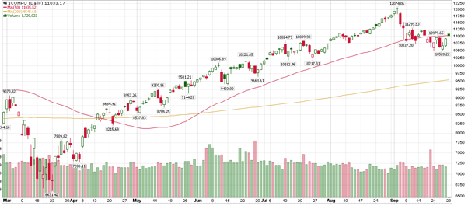
I must admit I’ve been cheering for the market weakness this month. A market break that generated enough fear that can be used to propel stocks higher in the coming months (see second chart below). Competition for stocks is almost non-existent with huge Fed support via 0% interest rates. We may now have an entry point where investing for a longer time horizon would be appropriate.# The month of September 2020 has been especially difficult for the stock market. From peak to trough stocks have declined by 14%. This decline negated the gains made going back to July. This is in contrast to our portfolios which declined by an approximate average of 3% to 4% due to a Sell Signal.
While no one really enjoys a selloff they are ultimately inevitable and healthy. Selloffs can create a significant amount of negativity which is necessary if the market is going launch the next leg higher.
Despite all the calamities of 2020 we remain in a Bull Market with an upside trend. A market that got a little too hot for its own good over the Summer and has now cooled off appropriately.
While we remain on a Sell Signal for the stock market there has been significant positive movement in the model. This could result in a Buy signal this week which is the first since April. If a Buy signal occurs, we’ll ease back into the market rather than plunge. If the Buy signal proves to have staying power market exposure will increase. The market has to earn our increased exposure.
A Buy Signal with staying power will be an excellent entry point as we transition from a seasonally weak period from August to October to the strongest period of the year (November thru March).
Please keep in mind that markets are discounting mechanisms. Meaning they’re not reacting so much to what is happening now, but anticipating the future.
IMO in September markets began to assume a Biden Presidency. While most of you look forward to this (including myself) it potentially bode negative for Big Tech stocks. Perhaps not in Year 1 or 2 but there will be increased scrutiny and the potential for increased regulation. This is the best explanation I have as to why Big Tech (Amazon, Facebook, Microsoft, Apple, etc) were the downside leaders.
In addition the strength in “Green” stocks has been the greatest in years. At present Solar Energy is the #1 performing group. The #2 group are Auto’s, specifically Tesla and Workhorse. Companies that are great innovators are leading and I believe this is due in part to a potential change in the White House.
Earlier I mentioned how fear can propel a market higher. The big market players which are institutional hedge funds, commodity trading advisors etc are positioned extremely negative. In other words they’re betting that the market will decline further to the greatest degree in 10 years.
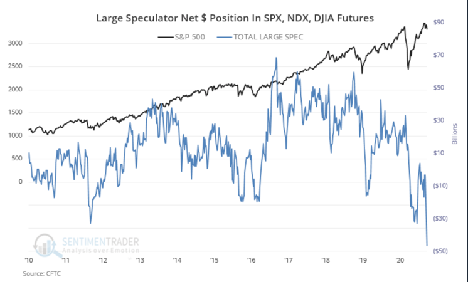
It’s never wise to invest along when the crowd is disproportionately positioned such as they are now. At present they are net short which is not that common but notice how being net short tends to coincide with market bottoms.
Summary; We are on the verge of a Buy signal for stocks. It’s not a fait accompli at this point. I am presently monitoring what could be the strongest stocks to emerge. At minimum, the market’s inability to decline lower is a change of character which is a very positive step..
Be Well. Be Kind.
Brad Pappas
September 28, 2020