RMHI Client Letter, July 16, 2023

RMHI Client Letter and Fact Sheet
July 16, 2023

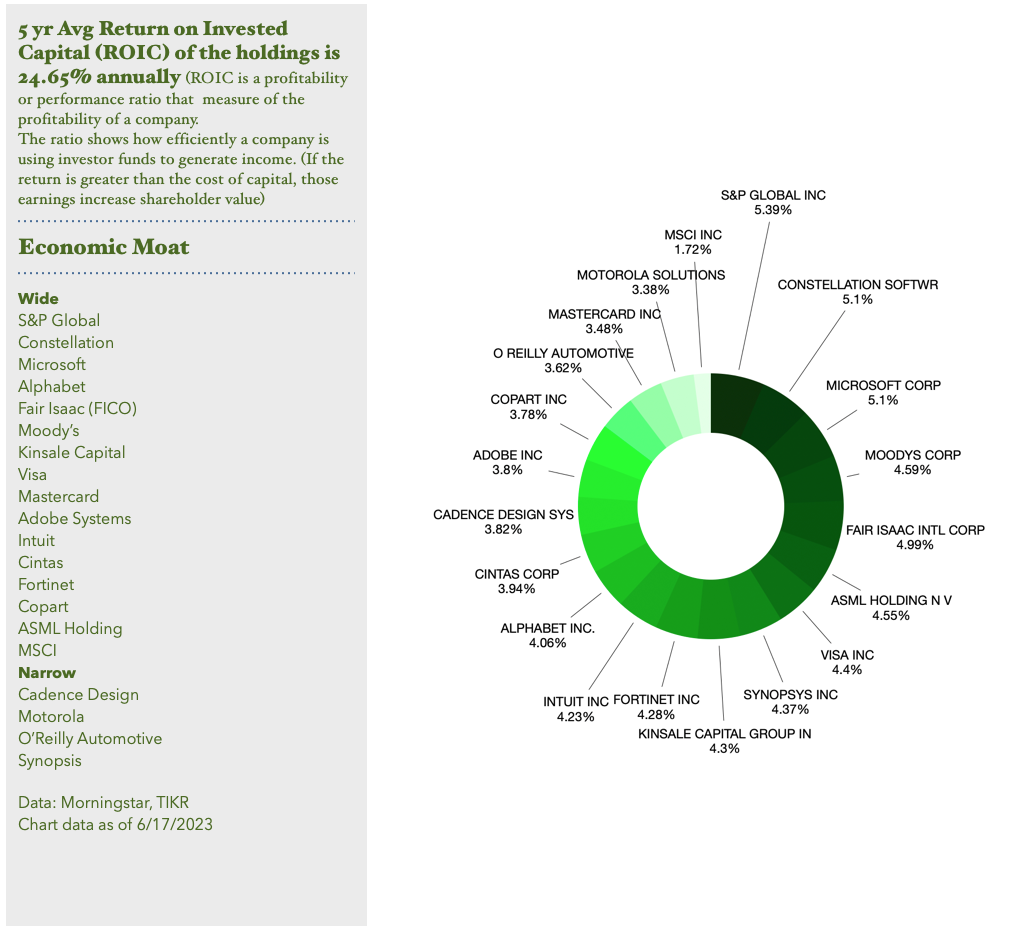
RMHI is a Colorado based state registered investment advisor that manages portfolios for Balanced and Growth investors.  RMHI established the first Cruelty Free Investing policy in the US in 1996.  RMHI manages a concentrated investment strategy that focuses on Free Cash Flow factors.  To be considered for investment a company must have consistent free cash flow growth, maintain positive free cash flow margins and consistent Returns on Invested Capital (ROIC) above 15% on average.  We add one technical measure of the stock’s stability relative to the S&P 500 over at least a decade.   We prefer stability over volatility.   Our goal is to minimize capital gains and transaction expenses by focusing only on companies that are capable of compounding value internally and by share price over a multi-year period.
socially responsible investing

One of the most common questions I receive is “Why is it better to receive little or no dividends on my stocks than owning stocks that pay higher dividends?”  It’s a reasonable question but the answer lies in the internal rate of growth in the company created by a high reinvestment return.   

The chart below shows the internal growth of a company with a Return on Invested Capital (ROIC) of 20% per year with no dividend.   Since there is no dividend there are also no taxes to be paid.

Socially Responsible Investing, Vegan Investing

The second chart below shows a company earning the same 20% on its ROIC but pays out 75% of its earnings in the form of dividends.  In this example the dividend paying company has Compounded Annual Growth Rate (CAGR) of 5% versus the CAGR of 20% for the zero-dividend company.  Not to mention that the dividends could be taxable

Despite this example many of our best holdings do pay dividends.  My preference is for companies to pay less than 25% of their net income in the form of dividends.   

In the past 30 days, two holdings were sold off with a modest loss and gain.  A company may be of the highest quality but if the stock cannot gain or it loses traction a decision has to be made.   A company that was sold for a loss can be reconsidered after 30-days.  If we repurchase within 30-days we lose any benefit of the tax-loss (for taxable accounts only).

Sales

Accenture ACN:  Cost was $308 and sold for $300.   Accenture had been downgraded by several brokers as future bookings are weakening.  Plus, the most recent earnings were positive but partially due to reduced tax rate.

Monster Beverage MNST: Average cost estimate of $53 and sold for $55.  The chairman of Bing Energy beverage passed away recently and Monster will be buying the company.   This purchase is the likely cause of the recent price weakness.   Growth appears to be slowing.   In 2020 their Return on Capital was 31% and in the last 12 months it has dipped to 22%.   Monster does not have a Wide Moat so competition could be having an impact.

Buys

Mastercard MA:  I’ve used the proceeds from the sales of ACN and MNST to fund the purchases of MA.  Mastercard operates as a duopoly with Visa and was in my opinion the best company to own which wasn’t in our portfolios.   The reason it was initially left out was its flat trading range for the past 3 1/2 years and the chart below shows it appears to be ending its dormant phase.  Due to its high ROIC the value of the company continued to rise internally.  Since the stock traded sideways it became a relative value due to internal growth.   Over time I’d like to add to MA since our total position is relatively small.
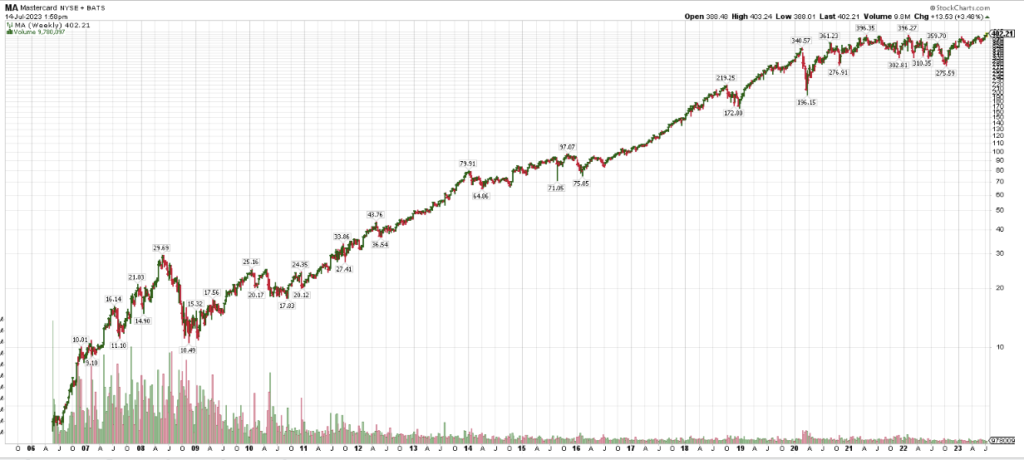
Investment returns for Mastercard are quite special:  MA went public 17 years ago and has returned 8353% in that time.   The compounded annual growth rate is 29.7%.  Since going public 17 years ago MA has outperformed Visa especially since 2016.

“Despite the evolution in the payment space, we think a wide moat surrounds the business and view Mastercard position in the global electronic payments infrastructure as essentially unassailable.  (Morning star)

Mastercard is one the best examples of what happens to investment returns when you have a strong and “unassailable” Moat.   What drives the price in MA shares is the incredible Return on Invested Capital of 60.8% for the past 12 months.  (Source TIKR)

In my opinion Mastercard is another company where it’s never made sense to sell, ever.  IMO the best place to look for companies that can deliver relatively smooth long term returns are with companies already doing so.

Update from Barron’s magazine for July 16, 2023:

“Mastercard and Visa have been on a tear and yet their stocks remain cheap.  Investors should take the opportunity to scoop up shares according to Nicholas Jasinski writes in this week’s edition of Barrons.  Visa’s current valuation multiple is a premium of about 30% over the S&P 500, half the historical average of roughly 60%.  The picture is similar for Mastercard – its cheaper relative to the market and its own history than it has been in a while.  Nothing appears to have changed for either company to warrant a multiple that low compared with the S&P 500, the author notes.”

Thank you for reading.
Brad Pappas
RMHI Client Letter, March 11, 2023

March 11, 2023

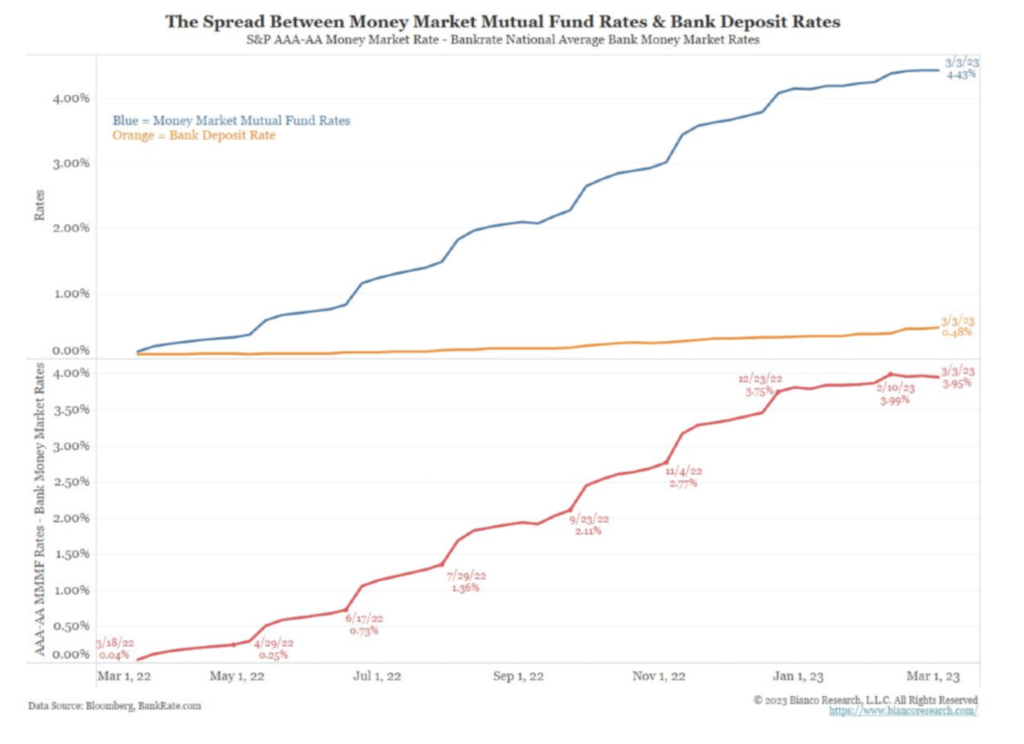
Late last year I noted a sharp difference between the bank deposit yields that Schwab was providing of approximately 0.4% versus short term T-bills of 4% or more. Seeing this interest rate spread I moved the majority of client cash to T- bills at +4% or more rather than let it sit in a Schwab earning almost nothing.

As I’ve mentioned this was a simple choice to make which allowed us to earn interest while the Bear market in stocks and bonds evolved.

Banks and brokers have been negligent in raising money market interest rates to be competitive to short term T-bills because they earn quite a bit of revenue off the spread. They’re able to earn risk free rates in 3-month T-bills at 4% or more while the source of capital (your cash in money markets) earns under 0.5%.

Socially Responsible Investing, Vegan Investing

Previously, outflows from bank interest rates were slow and since there was no urgency banks were slow to raise depositor interest rates.

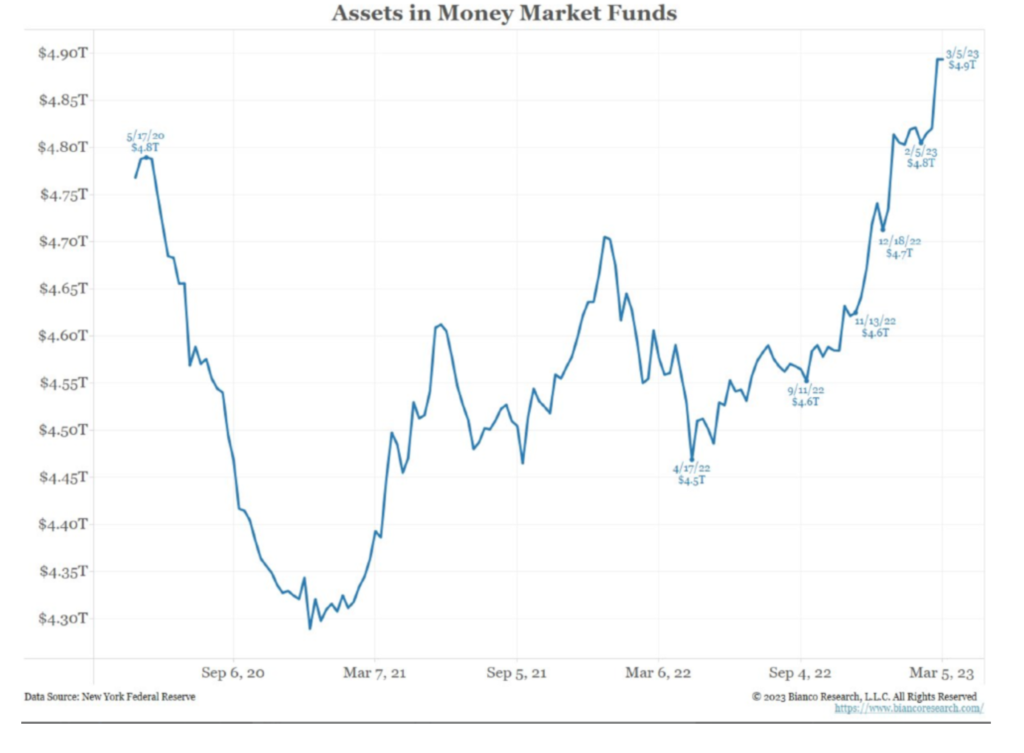
This lack of urgency changed when the Fed’s interest rate hikes grew meaningfully and investors recognized the interest rate difference.

The chart below shows how higher paying money market.

Socially Responsible Investing, Vegan Investing

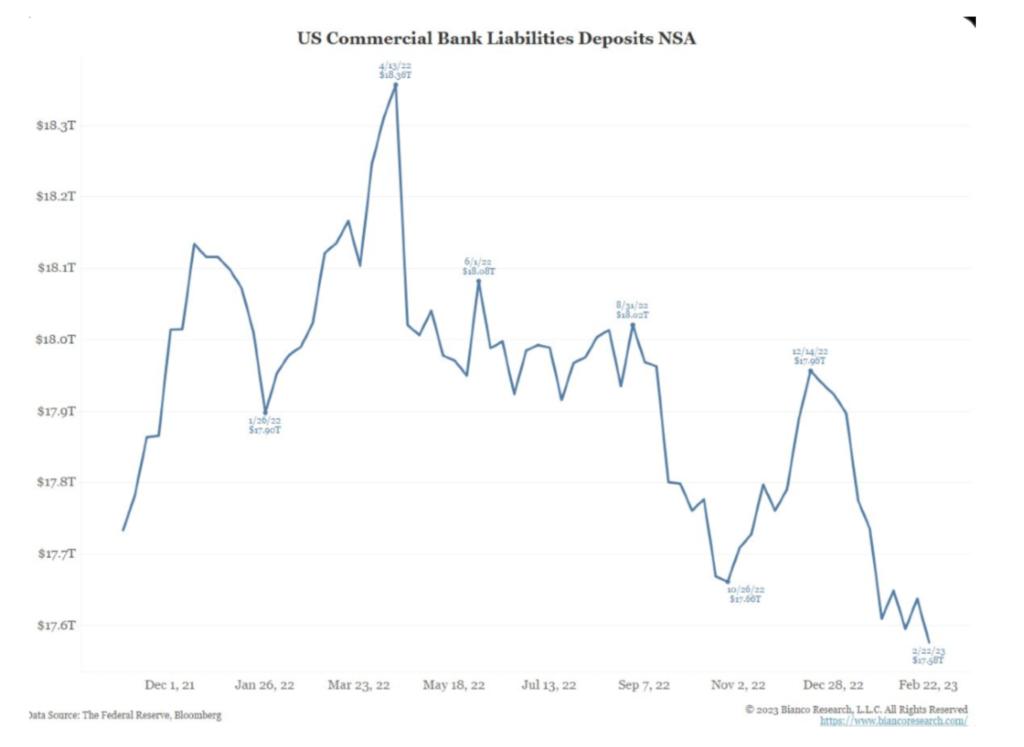
As bank deposits decreased dramatically and moved into money markets in the past six months it forced banks to increase their liquidity by selling off other assets to raise capital to meet demand.

This is where the rubber meets the road. Exactly how was the bank investing the client deposits?

This is where SVB got into trouble. There is nothing like a 40-year trend in lower bond yields = higher bond price values to make bankers complacent. SVB invested a very large percentage of depositor assets into long term bonds. In other words the bank too substantial losses due to complacency and a lack of risk control. SVB did not hedge their Treasury bond risk.

Socially Responsible Investing, Vegan Investing

If I were to use the $TLT ETF which holds Treasury bonds in the 20-30 year maturity range as a proxy: The TLT price peaked at $151 in December 2021. Yesterday it traded at $105.

SVB chose not to take the loss by selling and moved the bonds to a “Hold to Maturity” or HTM classification. If they took the loss it would have been reflected in their quarterly earnings reports.

Moving the bonds to HTM reduced the liquidity of the bank to meet day to day business. So, to replace the cash that was moved to the HTM category the bank offered to sell bonds, stocks and preferred to the investment community. Obviously, the offering was rejected and a run on the bank began.

Shares of SCHW were down 11% yesterday and I’m taking particular notice. At this time it does not appear they face the same risk as SVB. So far, SVB looks like an isolated event of risk of poor judgement and lack of risk management.

The decline in share price could come down to two distinct reasons: The long awaited merger with TD Waterhouse could be called off.

Second, the interest rate spread I mentioned earlier is a large source of revenue for Schwab. This is the age of no-commission trading so Schwab had to offset the loss of commission revenues in other ways. Paying next to nothing for deposits was large source of revenue.

Volatility

At present we have roughly 3% exposure to stocks. The balance is a combination of cash, Treasury bills and Municipal bonds. We have very little exposure to risk which allows us to be patient and let this storm blow itself out.

Many times I’ve said that when the Fed starts raising rates “things break”. SVB is case of a “Break” but I expect more to come. The breaks don’t have to come from banks, they can come from anywhere and they can be sudden.

Famous “breaks” are Enron, Worldcom and Madoff. All three emerged during Bear Markets.

For the past year and a half I’ve been very negative for stocks and was unable to embrace the rallies with any enthusiasm. Now, my tune is changing.

I will continue to be patient as there is no need to act right now. But my sense is that at some point (and there could be many points) in 2023 stocks will bottom and offer a great opportunity for those who’ve protected their assets this year.

My focus will be on the highest quality holdings. Major market bear markets are the best time to buy the highest quality stocks. Depressed prices offer a great opportunity to buy into franchises that rarely meaningfully sell off. These are the companies you can hold on to for the long term.

These companies are dominant in their category and frequently have a wide moat (dominant and difficult to compete against).

Examples are:

Monster Beverage
OTC Markets
Accenture
Adobe Systems
Autozone
Cintas
Google
Home Depot
Moody’s
Old Dominion Freight
Mastercard and Visa
Microsoft

We can afford to be patient and sit on our hands waiting for the right time to move. I suspect it will be this year. The time to be negative in the long term is over. Now is time to look for opportunity.

When the stock market rallies, the expected forward return for stocks declines.

When the stock market declines, the expected forward return for stocks rises.

Thank you for reading and being a client.
Brad Pappas

Waiting for the Fat Pitch

Waiting for the Fat Pitch
Feb 2023

For those not familiar: The Fat Pitch is a baseball reference for when a pitcher leaves a pitch flat and over the center of the plate. Meaning, that a pitch in the red zone offers the highest success percentage for a base hit. A disciplined batter will avoid low odds pitches and wait for a pitch right over the plate. No one put this concept more succinctly than Ted Willams.

Socially Responsible Investing, Vegan Investing

For Ted Williams, the orange and especially the red zones were his ideal sweet spot. A spot he rarely missed which is depicted by the batting average inside each circle. In a career if you hit over .300 (a base hit in 30% of your at-bats you might well be in the Hall of Fame. He hit .344 during his career and he is arguably the greatest hitter of all time.

How does this apply to investing? I am waiting for the Fat Pitch aka the pitch in the red zone that has the highest probability of success. It’s expected there will be several tempting entry points for growth in 2023. My effort is to patient and wait for a pitch in the red zone.

For example in the Dot Com bust of 2000 to 2003 the top 5 Bear market rallies in the S&P 500 of 24%, 19%,12%,12% and 11%. But the peak to trough drawdown during the same period was -49%.

In the Great Financial Crisis of 2007 to 2009 the top 5 rallies were 21%, 21%, 21%, 19% and 15%. The peak to trough drawdown during the same period was -56%. 

Investors who chase these interim rallies are swinging at bad pitches with low success rates. Fear or FOMO (Fear of Missing Out) is an important driver for investors who think the markets can’t go lower and “This is the bottom”. 

We remain in a Bear Market

How will we know we are transitioning from Bear to Bull Market or in the example above to Fat Pitches?

  • A series of aggressive interest rate cuts by the Federal Reserve. Lower rates allow stocks be more relatively attractive. Hiking rates makes them less attractive.
  • An obvious recession: No more debates as when, if or how bad will the recession be. It will be obvious especially when the unemployment rate rises.
  • The yield on 9 month Treasury Bill 4.9% and the dividend yield on the S&P 500 1.7%. At present the gap is potentially serious. A recession with falling stock prices would increase the dividend rate for stocks. Plus, the Federal Reserve would lower the Fed Funds rate which would narrow the gap.
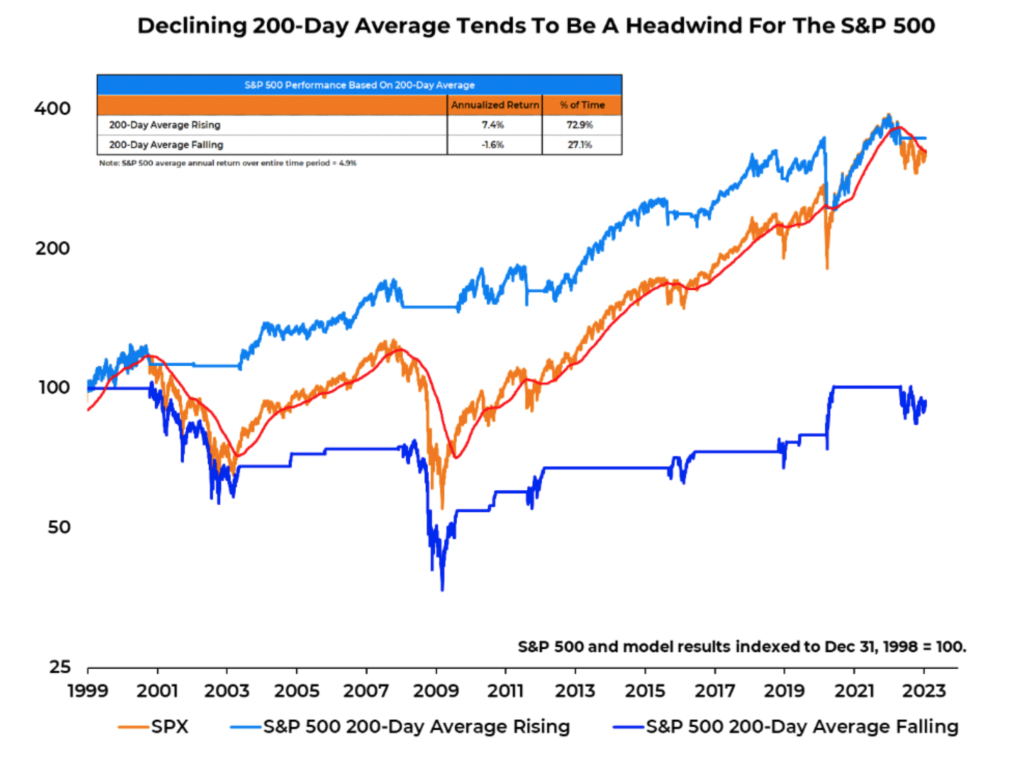
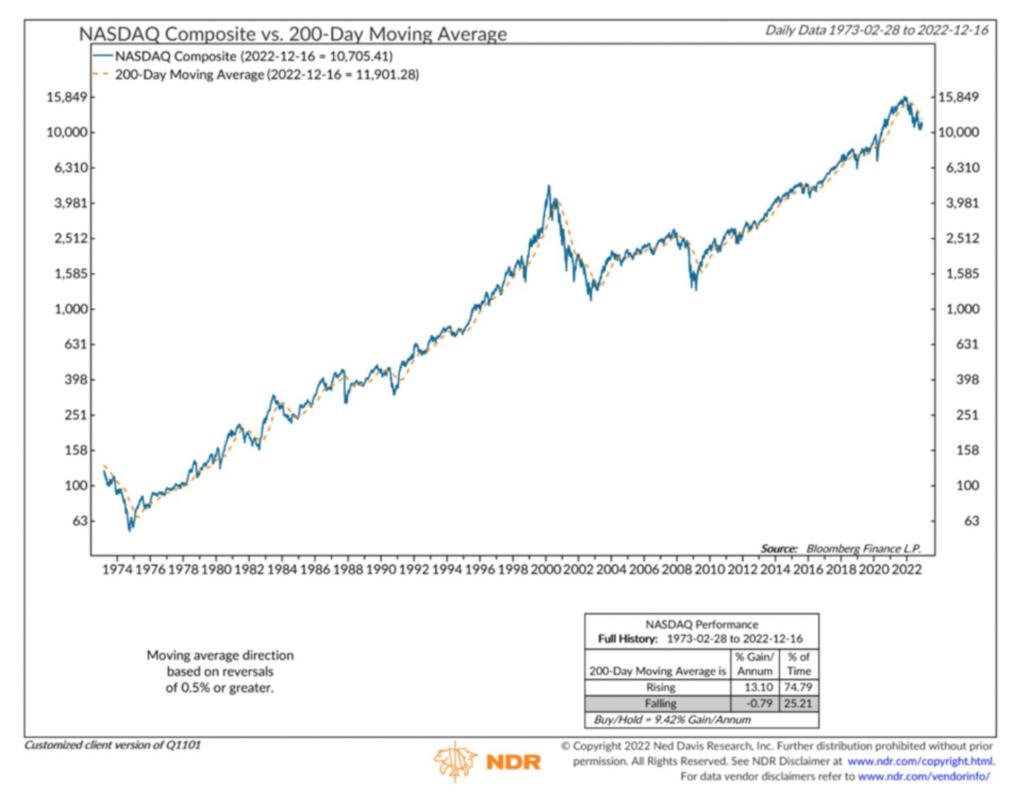
  • Finally, the downward slope of the 200-day moving average of the S&P 500 and the NASDAQ reverses to the upside. If there is a single factor that could signal the end of the negative trend in prices it would be a new upward slope of the 200-day moving averages. See the two charts below. Upward and downward slopes have a contrasting binary outcome.

Socially Responsible Investing, Vegan Investing

Upward slope = +7.4% annualized rate of return
Downward slope = -1.6% annualized rate of return

Nasdaq Composite

Upward Slope = 13.1% annualized rate of return
Downward Slope = 0.79% annualized rate of return

Socially Responsible Investing, Vegan Investing

To further define what it means to be buying stocks in a downtrend. Buying into a downtrend forces the investor to be a trader rather than a long term investor. Estimates have shown that over 70% of a stock’s behavior is due to underlying trend of the stock market as a whole. So by my way of thinking buying stocks in a downtrends is swinging at bad pitches.

If I’m completely wrong in my summary there is an exception. All transitions from Bear market to Bull market are confirmed by a trend change in the 200-day moving average. The 200-dma moves into an uptrend by default if stocks continue to show strength long enough.

Recent market strength

Markets view Fed Chair Powell as weak. In other words, they don’t see Powell as having the will to drive inflation into the ground with rate hikes. He’s not former Fed Chair Paul Volker who pushed rates to 20% in March 1980.

Volker at 6’7 with billowing cigar smoke in congressional hearings was the Capo Di Tutti Capi of Fed Chairs. Not to be intimidated by anyone especially Congress. The result of his rate hikes was the recession of 1981. However, his efforts put an end to the inflation of the 1970’s.

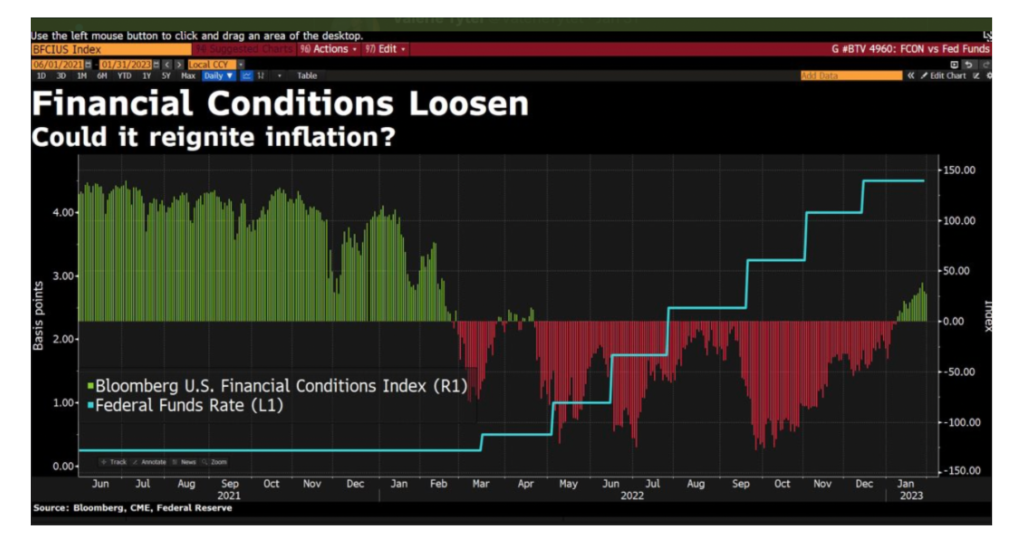
The probable cause of the most recent rally is the state of financial conditions which are signaling economic growth by easing financial conditions. 

Socially Responsible Investing, Vegan Investing

is could mean a return of inflation and higher Fed Funds rate. Employment is not showing many signs of weakness which is problematic for the Fed. This could mean there is a future rug pull ahead (the Fed being forced to raise rates higher than expected and turn financial conditions back to the red). 

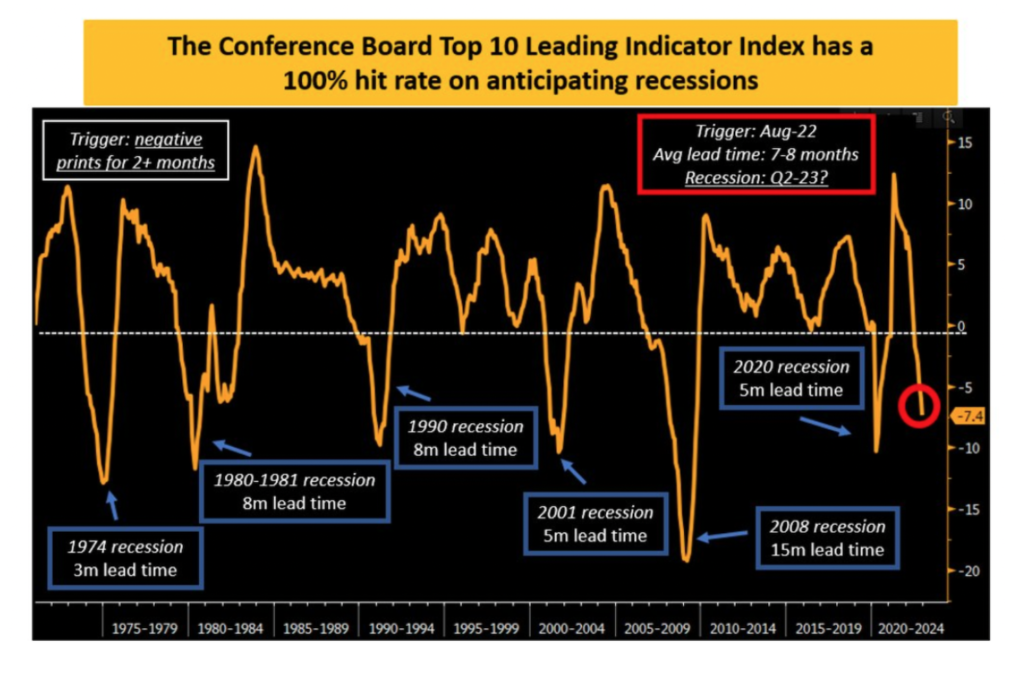
Source: The Conference Board

The Conference Board Leading Economic Indicators has moved into the recession zone.

Socially Responsible Investing, Vegan Investing

Summary: Absolute Inflation has probably peaked but there can be more peaks in the cycle (from lower levels). Based on the Conference Board LEI we should be in a full bloom recession by mid 2023. 

If the recession is confirmed I could envision another steep decline of 20% to 30%. This would force the Fed to lower the Fed Funds rate and stimulate the economy. It might arguably be the best entry point for stocks in many years.

Any potential entry point until then offers relatively mediocre or poor risk/reward.

So we just wait for the eventual “Fat Pitch”.

Thank you for reading

Brad Pappas
February 6, 2023

RMHI Client Letter, December 20, 2022

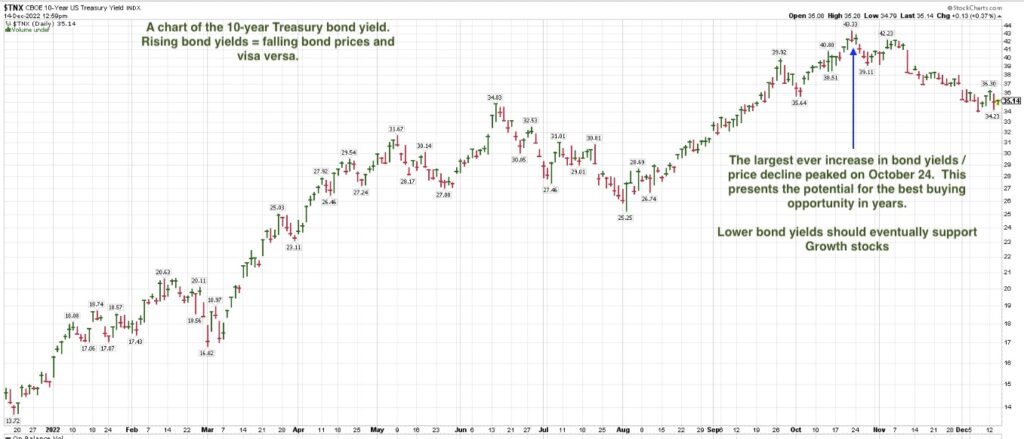
It appears the biggest ever increase in 10 and 30 year Treasury yields / bond price declines ended on October 24.  In my opinion the rally in Treasury bonds has created on the best opportunity in years.   The timing is obviously tricky but prices should continue to rise as the economy weakens in 2023.

socially responsible investing, vegan investing


So with todays 50 basis point hike in the Fed Funds rate we have over 85% of all yield curves inverted.   This is a powerful indicator of problems ahead for both the economy and stocks.   

The Federal Reserve can only control short term interest rates, they have no control over long term rates or bond prices.   So, while the Fed in their wisdom is raising short term rates despite sharply declining inflation data.   (Inflation peaked 6 months ago in June at 9% annual rate.  But the annualized CPI rate since June has just been 2.4%.  The Producer Price Index since June is 1.1% annualized.

Meanwhile the Fed and speakers like Chairman Powell keep talking about raising rates and keeping them higher for longer.  It’s as if they don’t comprehend that inflation data has already rolled over.   If they follow their words with actions this could be a significant policy error, leading to a much deeper recession.

Or, a major policy reversal prompted by weaker incoming data that grabs their attention.   It’s really impossible to predict and certainly not the time to put assets at risk.

The long term bond market is defying the Fed and essentially saying: “We can see where this is going to end up later next year since you’re still raising interest rates with the economy rolling over.  So we’re going to lock in our interest rates on bonds because the Fed will be cutting rates in 2023.”  

The Treasury bond market is front-running the Federal Reserve.   Historically, the Fed has cut interest rates by 3 full percentage points or 300 basis points.   After todays hike the current Fed Funds rate is 4.5%.

If the Fed were force to cut rates by 300 basis points in 2023 and 2024 the rate could drop as low as to 1.5%.

* Our earliest purchase of the TLT (30 year bond ETF (exchange traded fund) was made with the yield at 3.92%.   Last weeks the yield on the 30 year Tbond was 3.41% a decline of 51 basis points.  Or, in price terms $100.08 versus todays (12/13/22) price of $107.6.  Our average price paid for the TLT is $101.96

  • The paragraph above was written the week of December 12, 2022.  Since then Treasury bonds have fallen by about 5-6% as of December 20th.    While the potential for a good return still exists the retreat in bonds triggered one of my most important investment rules:

“Never allow an investment with a positive return become a loss.”  Or, in this case don’t let my conviction on T-bonds prevent my exerting risk control.

The TLT ETF whose cost was 101.96 was sold for 103.36.
The TLH was sold for 111.09 versus cost of approximately 110.6

socially responsible investing, vegan investing

The Treasury bond market is screaming that recession remains the mostly likely economic outcome for 2023.    If you’re trying to be a long term investor right now, understand that the Fed is not your friend.   They are deliberately trying to put the economy in recession and drop the stock market by another 20% to 30%.

Please keep the chart above in mind when you see that Fed chair Powell said today: “I don’t think anyone knows whether we’re gonna have a recession or not – and if we do, whether its going to be a deep one or not.  It’s just not knowable.”

socially responsible investing, vegan investing

Yield Curve Inversions are an accurate barometer for recessions and big stock market declines.

2023

The late Bill Meehan taught me that predicting the future is a mugs game. The odds of market’s recovering in 2023 is good.  Both due to the length in time of this Bear market, the eventual return to positive monetary policy which is prompted by lower inflation.

But, timing is everything. It’s not my intention to try pick the bottom of any market, thats for the foolish and clueless.

The chart below is courtesy of Ned Davis Research.   Inflation has truly rolled over as seen below.   I doubt any Fed Governor wants to be remembered for a huge recession by raising rates into falling inflation.   So its possible we may have seen the last of rate hikes regardless of what the Fed says today.

socially responsible investing, vegan investing

 This final chart is once again from Ned Davis and it displays a very simple yet effective timing tool to judge when it will be safe to return in size to stocks.

There is an immense disparity between stock returns when the 200-MA is trending higher versus trending lower; 13.1% versus -0.79%.  Fortunately, the time spent above the 200 day MA is 74.79% since 1973. 

socially responsible investing, vegan investing

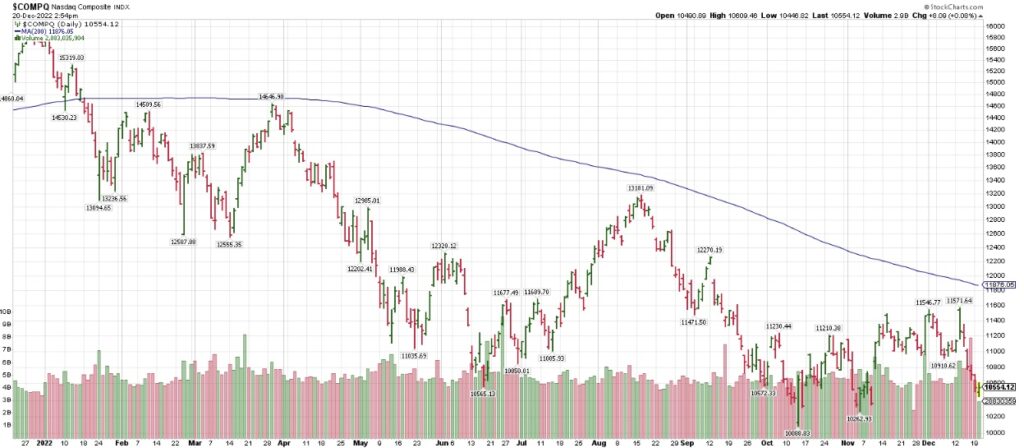
Current Nasdaq versus the 200-day Moving Average Trend (Down)

socially responsible investing, vegan investing

The trend remains lower for stocks in the long term.   If I were to guess as to how 2023 goes:  I’d be looking for a final stock market bottom in the first 4-5 months of 23.  Followed by a period of stabilization with a formative rally in the 4th quarter lasting multiple years.

Recently the state of California sent out a questionnaire to all registered advisors regarding our exposure to FTX and its cohort bankrupt imploded buddies.   We had 0%.  But the entertainment value of watching the revelations is tremendous.

Thank you for reading

Brad Pappas

RMHI Client Letter, Nov 9 & 10, 2022

Does this rally have legs?

November 9th and 10th 2022

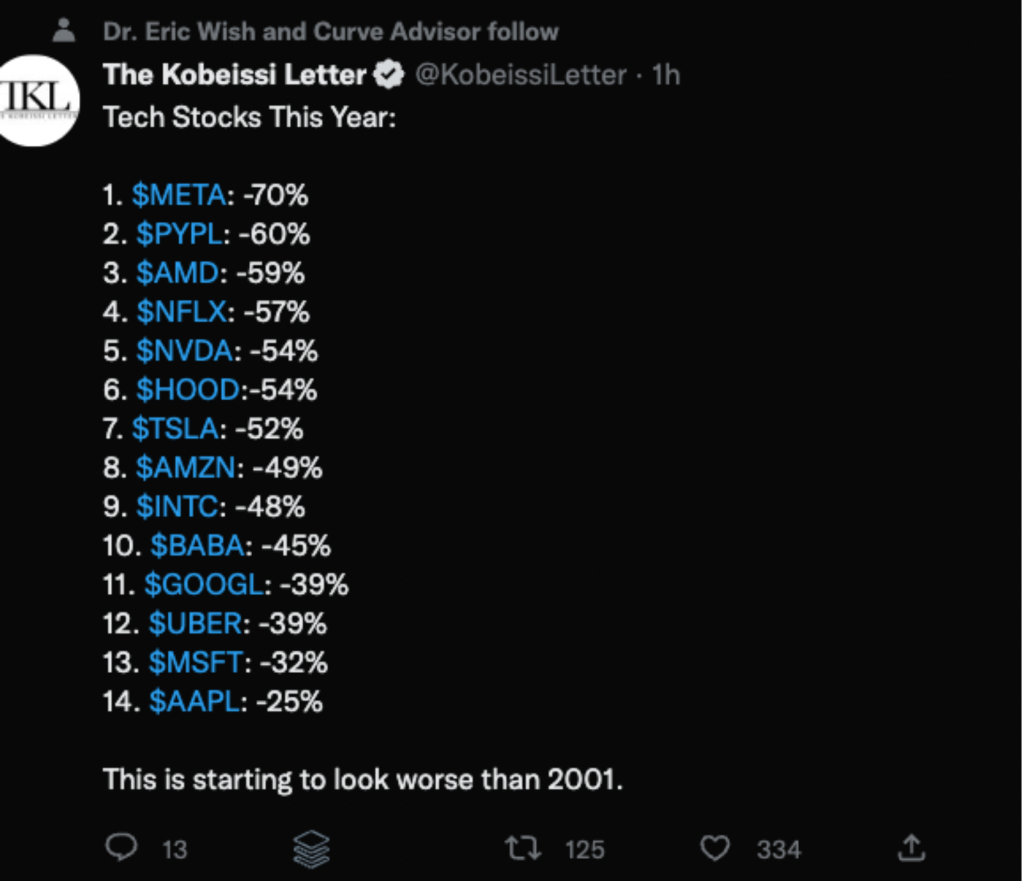
The last decade will be known as the Decade of the Big Tech Growth Stocks. A temporary period where investors deluded themselves into thinking the only stocks worth owning were shares in Technology: Amazon, Apple, Facebook, Microsoft, Google. These stocks represented approximately 23% of the S&P 500 Index.

This is not the first time its happened since human psychology tends to repeat itself. In the 1970’s there was the “Nifty Fifty” and you’re going to have to be of a certain age to remember these names. (Remember people thought they could buy these stocks and hold them forever. Many don’t exist anymore.)

Digital Equipment: financial problems forced a merger into Hewlett Packard.
Eastman Kodak: Bankruptcy
Emery Airfreight: Sold to Consolidated Freight after failed hostile takeover.
General Electric: 2011 forced into restructure after profitability collapsed.
Heublein: Sold to RJR Reynolds Tobacco which sold off Heublein’s assets.
JC Penny: May 2020 Chapter 11
Poloroid: 2008 Bankruptcy
Sears, Roebuck and Company: October 2018 Bankruptcy
Simplicity Pattern: 1998 sold to Conso International
S.S. Kresge: Renamed Kmart in 1977. By 2005 was part of Sears.
Upjohn: Acquired by Pfizer.

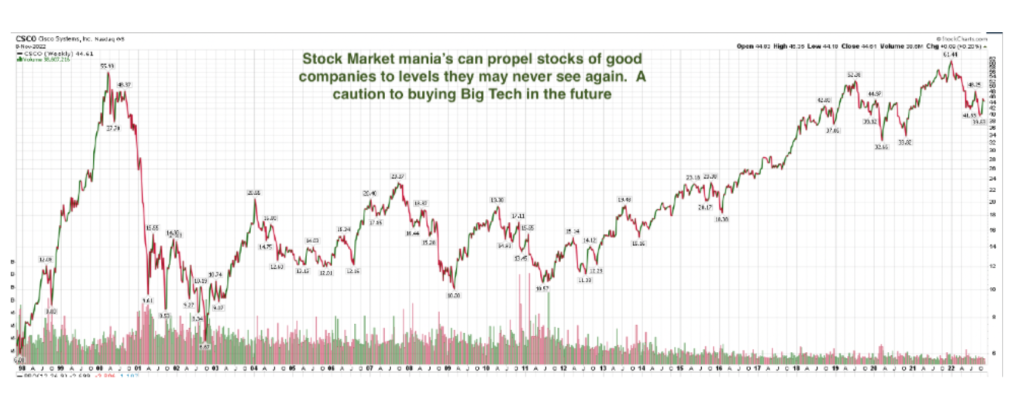
Just 22 years ago another generation of must-own stocks represented 18% of the S&P 500.

Microsoft
Cisco
Exxon
Mobil
General Electric
Intel

In this group only Microsoft and Exxon were able to maintain relevance. While Cisco remains a viable company the stock has yet to exceed its year 2000 high. 22 years is a very long time for dead money.

socially responsible investing, vegan investing

As for 2023 investors should expect no different.

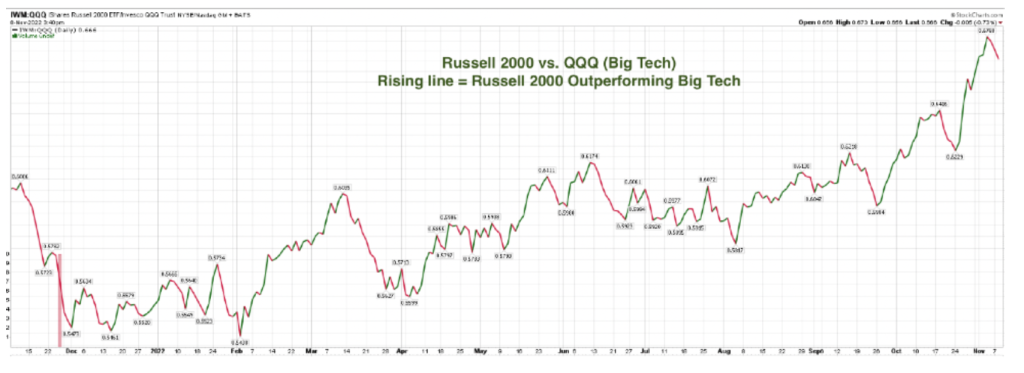
The point I’m trying to make is that is common for investors to look at past favorites in the hope they’ll be future top performers. But it’s a very flawed strategy in real time. If you remember my letters from last year a high percentage of money was flowing primarily into Big Tech. Now the reverse is happening. The migration of capital out of Big Tech continues and that money is moving to the Russell 2000 Index composed of smaller company stocks which underperformed while Big Tech was dominating for the past decade.

If I were to guess I would say that we’re in the 7th inning of this Bear Market.

socially responsible investing, vegan investing

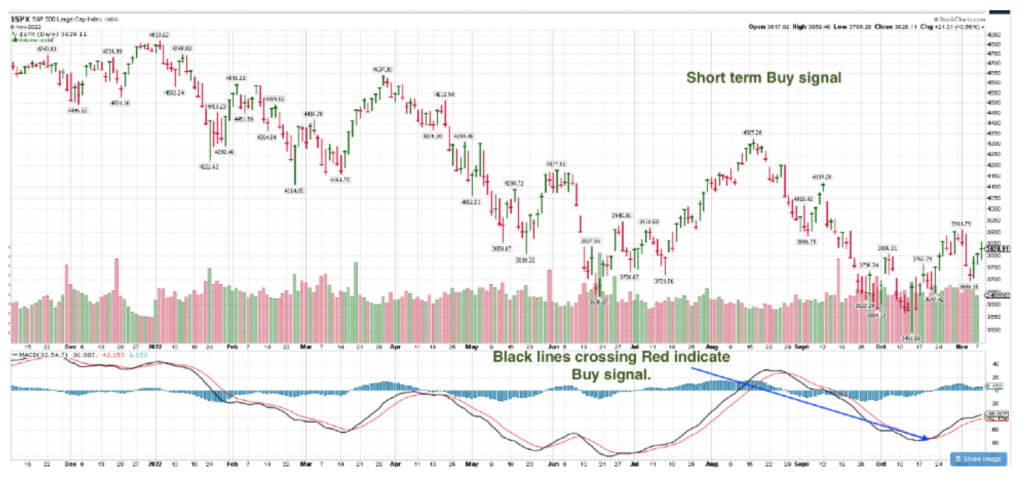
A short term Buy signal for stocks. (But not Big Tech)

MACD short term buy signal (Moving Average Convergence Divergence). Created by Gerald Appel in the 1970’s which shows changes in direction, momentum and strength of a stock or a market index. Longer term signals remain “out of the stock market”. But, short term signals are always the first to turn negative or positive.

socially responsible investing, vegan investing

New market leadership and a new trend will emerge as it always does. If a new Bull Market for stocks was to begin the stocks of smaller companies might be where it begins.

The chart below shows how the small stock Russell 2000 is outperforming the QQQ (proxy for Big Tech) when the line rises it indicates outperforming the QQQ. If investing was ever easy the leaders of the last bull run would repeat in the new one. Simple idea but its wrong.

socially responsible investing, vegan investing

Last month was extremely negative and investor sentiment was awful. This generally bodes will in the near term future results and at least a short term rally has occurred. I’m playing it very conservative with companies that are non- cyclical or not very sensitive to the economy.

We are only invested minimally in the strongest sectors and industries, primarily healthcare and insurance. Every stock we own has done well this year on an absolute and relative basis. I no desire to try to catch falling daggers aka tech stocks.

Update November 10, 2022

This mornings CPI inflation data came in below expectations as the year to year came in at 7.7% versus a forecast of 7.9%. The market exploded to the upside on this news with the Dow exceeding 800 points in less than a minute.

Fed chair Powell has said he’ll be watching the data closely as a signal for when they can minimize interest rate hikes. Markets are possibly pricing in an end to the hikes earlier than expected. If todays data is the start of a trend to lower inflation it would be a positive for both stocks and bonds. Longer term the Fed can move to a more accommodative policy in 2023.

Much of the biggest movers today to the upside are beaten down past leaders that are still in strong downtrends.

There is no need to chase stocks or bonds higher at present. If this rally has legs there will be ample opportunity to rebuild portfolios for a new Bull run.

Thank you for reading

Brad Pappas