“The Federal Reserve…is in the position of the chaperone who has ordered the punch bowl removed just when the party was really warming up”.Fed Chair William McChesney Martin 1955.
“I think we are actually at the point of encouraging risk-taking and that should give us pause. Investors really do understand now that we will be there to prevent serious losses.” Fed Chair Powell in 2012.
“If the Dow Joans ever falls more than 1000 “points” in a Single Day, the sitting president should be “loaded” into a very big cannon and Shot into the sun at TREMENDOUS SPEED! No excuses!” DJT tweet, February 25, 2015, 12:27am
Any wonder why we seem to have more risk asset bubbles these days?
Quick Summary
Stocks: Stocks have have made a stunning rebound from a near-death experience last year and continue to trend higher. On any market weakness, the White House continues to trumpet a near and close China trade deal. In addition, the economy has turned modestly up again which provides a positive back drop for stocks. My guess is there is a selloff looming as the current rally is losing steam. But the Fed will likely step in and lower rates if a selloff occurs, so the decline would be worth buying.
Fed Policy: The Fed has done a complete 180 turn which provided positive stimulus to both markets and the economy. Much of this has been done at the expense of Fed credibility.
Considering the public pressure being imposed by the President both in public statements and Fed board nominees, we do have to wonder how unbiased they really are.
DJT’s preference to stuff the board with sycophants is troubling but there has been stiff resistance to Cain and Moore. Kudlow’s claim that they’ll never hike rates again in his lifetime is just as bad. Investors may feel invincible with the mistaken belief that the Fed will bail them out from future declines.
The bottom line IMO is the Fed being willing to risk their creation of another asset bubble in the hopes of extending the economic expansion is irresponsible. Our expanding deficits will never be paid off either. Eventually this view will be inflationary wherein the dollar has little meaning and makes a case for Gold longer term.
Economy: After last years series of ugly macro data, a Spring rebound led by employment and housing is underway. A recession starting in 2019 doesn’t appear likely. This is similar to what we experienced in 2015 and 2016.
Treasury Bonds: Since we’re not facing a recession in the near to medium term, the rationale for owning Treasury bonds diminishes. Bonds will likely be a drag on returns and holding uninvested cash in money markets is likely a better alternative.
The bearish argument for bonds is MMT otherwise known as Modern Monetary Theory. Simply stated, MMT is the federal government printing of new money to fund governmental expenditures. One of the risks is a significant increase in inflation. More to come.
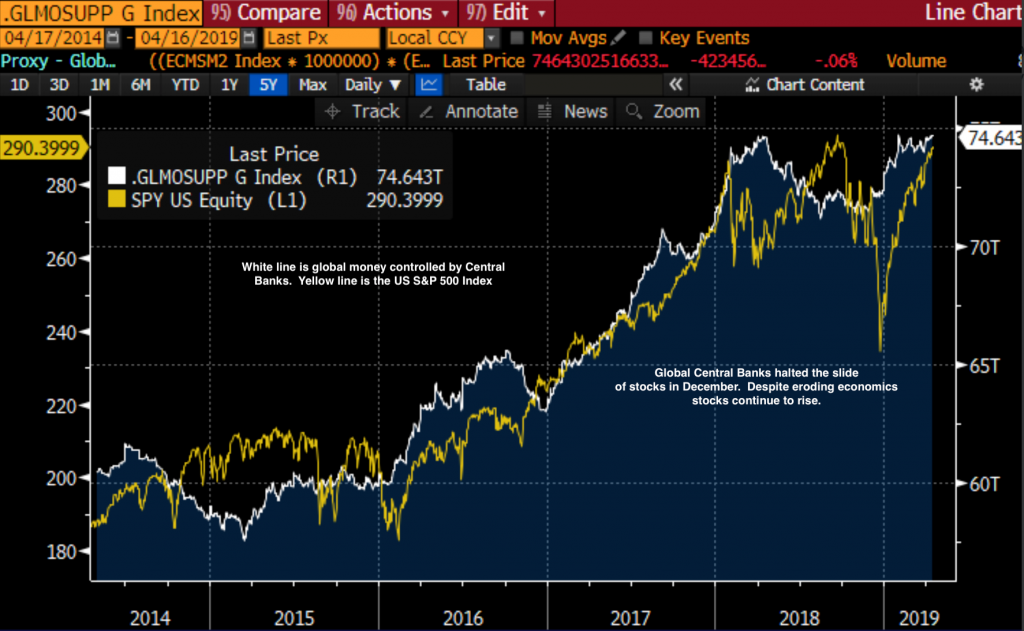
Despite the market strength from the late December lows it has been a frustrating period for an investor who uses the past as a guide to the future. While we did manage to keep losses minor in the September to December selloff, we have not nearly kept up with the resulting rally.
The Fed and other Central banks stepped in to halt the decline by easing their monetary stance. Markets should be allowed to trade without continual interference from the Fed since occasional purges are necessary to avoid – otherwise the Fed will create a much larger asset bubble.
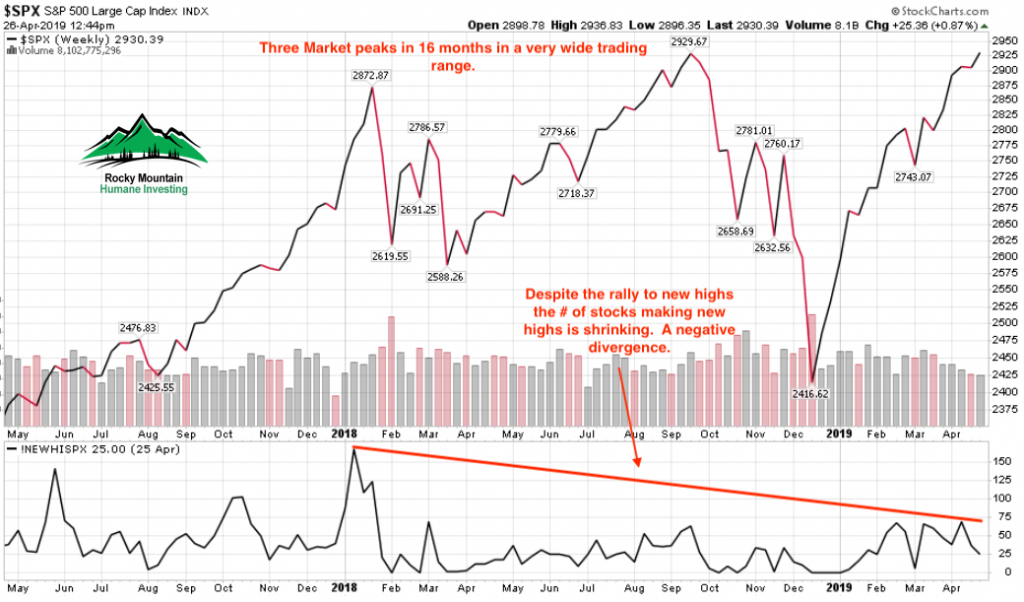
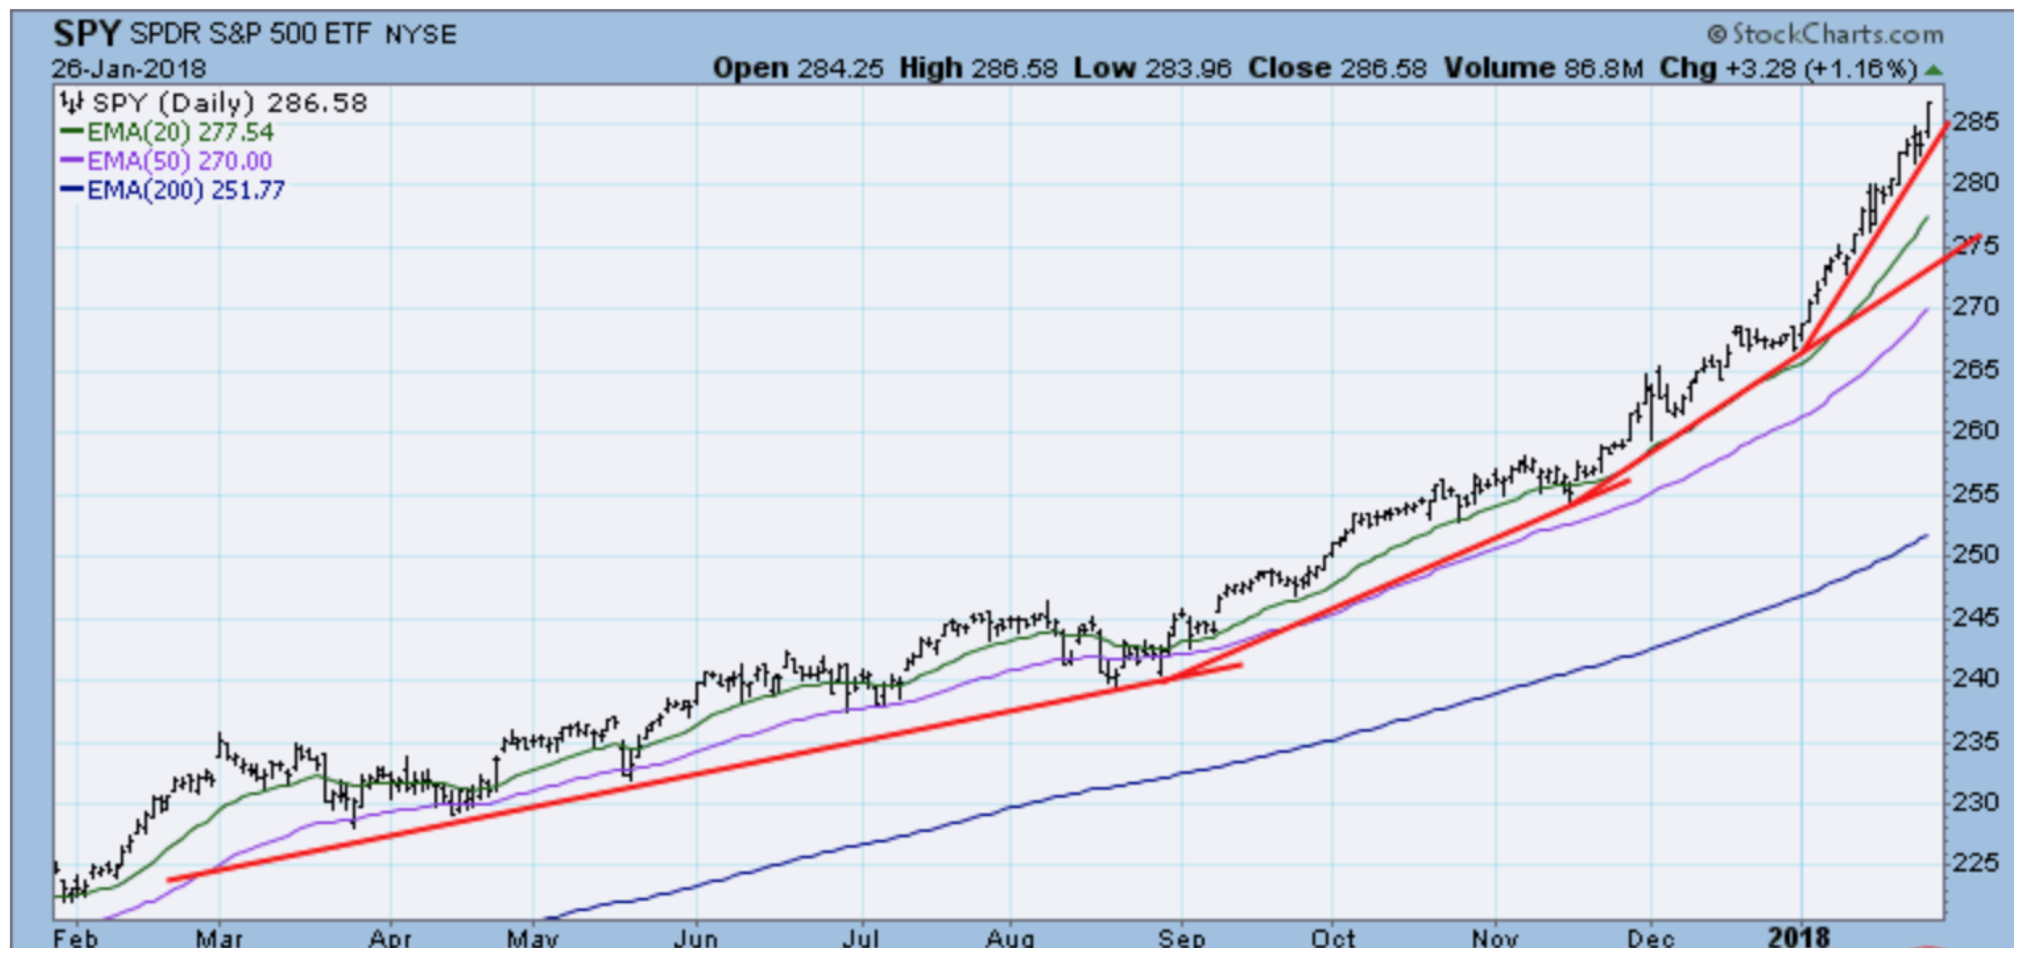
There’s no way to ever be sure where the market will bottom, especially when selling gets as emotional as it was last year. As I’ve mentioned several times, V-shaped market rebounds are generally a low probability since 3/4 of all market selloff’s retest the recent low in a matter of days or weeks. For example, from the chart below, the January 2018 selloff retested the lows 3 times. The precipitous decline late last year did not retest even once, which left us too cautious when we should have been much more aggressive.
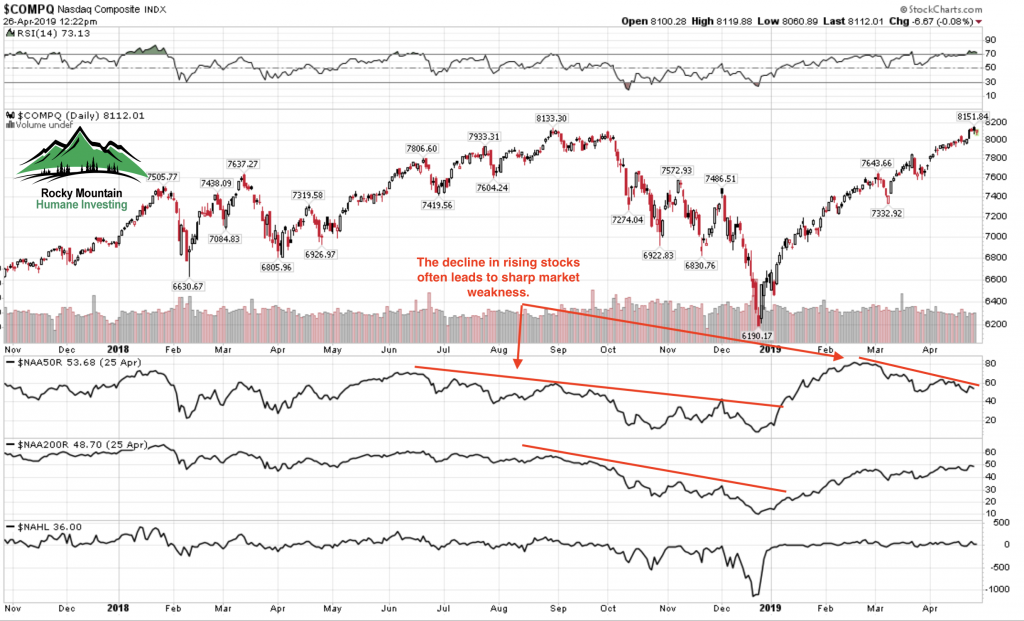
In addition, despite the new highs in the indices, there is erosion below the surface. The number of stocks participating in this rally in the Nasdaq is declining. When I see this kind of erosion in participating stocks, I prefer to hold higher than average amounts of cash in lieu of trying to force the issue. Early warning industries like semiconductors, such as previously held Xilinx and Nvidia, have issued warnings of declining sales which means the underlying global economy is not good. Even Amazon, which reported great earnings and continues to grab market share, is seeing the slowdown as well.
Fewer stocks are holding above their moving averages, revealing a weakening rally and likely selloff.
In addition, the number of stocks making new highs is shrinking fast. These are signs of an old tired market that needs a pullback. In my experience, this is a time to have high cash levels rather than increasing stock exposure.
And then there’s this…..
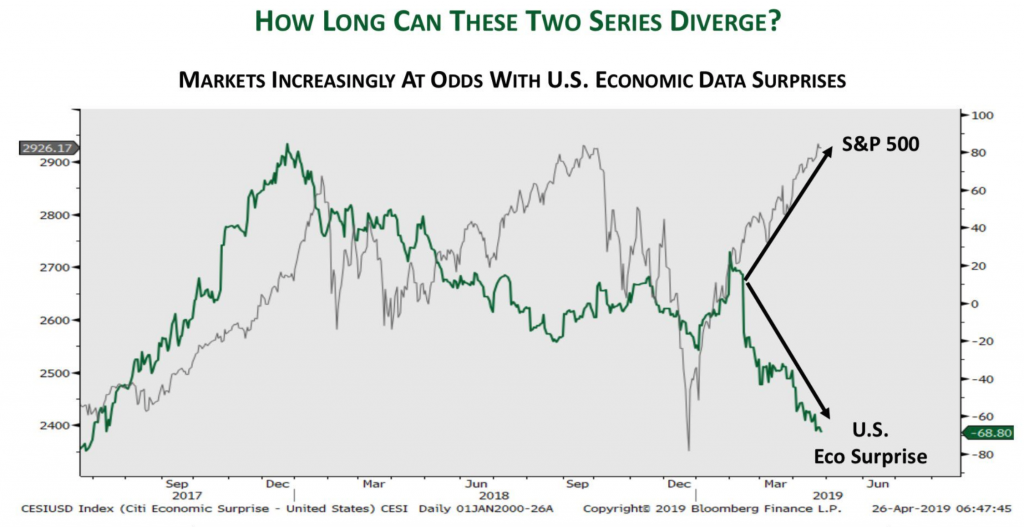
Stocks tend to move in sync with economic surprises. The current gap is due to the significant rally in stocks while the economy has been slowing. Something has to give eventually. Either data turns up or stocks come down or meet in the middle.
The first four months of the year have been the most challenging for myself in years. I read today that this year’s rally is the strongest since 1987. And, the commentators say that without irony or dare mention what happened in the second half of 1987. If you’re unaware, it fell 22.61% in a single day (October 19, 1987).
The presidential administration isn’t even trying to hide the fact they’re manipulating markets to their political advantage. If it isn’t the “trade negotiation are going really well” ad nauseam before markets open or middle of the day on a down market day. Or, Mike Pence: “The economy is roaring. This is exactly the time not only to not raise interest rates, but we ought to consider cutting them.” This is blatant and so wrong-headed it staggers me. This should be the time for the Fed to slowly raise rates so they’ll have firepower to fight the next recession.
Does this mean the time to raise rates is in a recession?
But this is all about the next election, to keep a very old economic expansion alive thru 2020 to get re-elected. In their eyes, market selloffs are merely “glitches” which they take no responsibility for because, in their eyes, markets are meant to only go higher, never lower.
Investors not paying attention will eventually get badly burned. Mean Reversion is one most reliable investing concepts there is. From tulips and bitcoin, to stocks and real estate, all bubbles eventually end. The end is always fast especially for those unaware.
Despite my expressed negativity I’m not calling for a bear market at present. Investor sentiment is extremely positive (which is not good) and similar to what we saw last January before markets sold off quick and deep. But any serious weakness will likely be met by Central Bank easing or cuts by our own Fed. So I think any dip is buyable.
As for where we are currently: We are now entering the most difficult 6 month period for stocks and rather than try to make up our lagging year-to-date performance by increasing risk, I prefer to wait for a decline. Eventually even in this endless market advance a “glitch” has to be looming somewhere.
Quick Summary: The end of an era may be at hand. The rally in bond prices that dates back to 1981 appears to be over. I’m not convinced it’s over for good but that’s an argument to be made later on.
In the meantime, falling bond prices represent a headwind for stocks and could remain so until bond prices find a short term floor. This headwind accelerated the decline in stocks on October 4th and 5th. This prompted me to raise cash from holdings that either had losses or were laggard holdings. A portion of cash was used to purchase hedges to offset any future stock price declines.
It’s most likely that this is just a short or intermediate termed decline in stocks as the long term trend remains firmly in place. Part of the purpose of quick market declines is to make investors fearful and uneasy, one reason we use hedges to cushion declines.
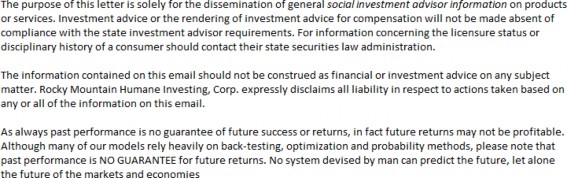
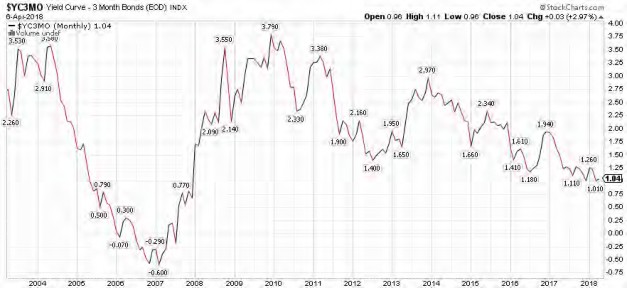
Chart 1: This chart below shows that the long term trend to lower interest rates is being threatened. This can’t be a surprise with the rapidly expanding deficits and very low unemployment. But as I’ve highlighted with arrows: it’s not uncommon for interest rates to rise in the latter stages of the business cycle, only to fall hard when the Fed raises rates enough to trigger recession. I don’t see this time as any different. My best guess is the current bond weakness is a future buying opportunity later in 2019.
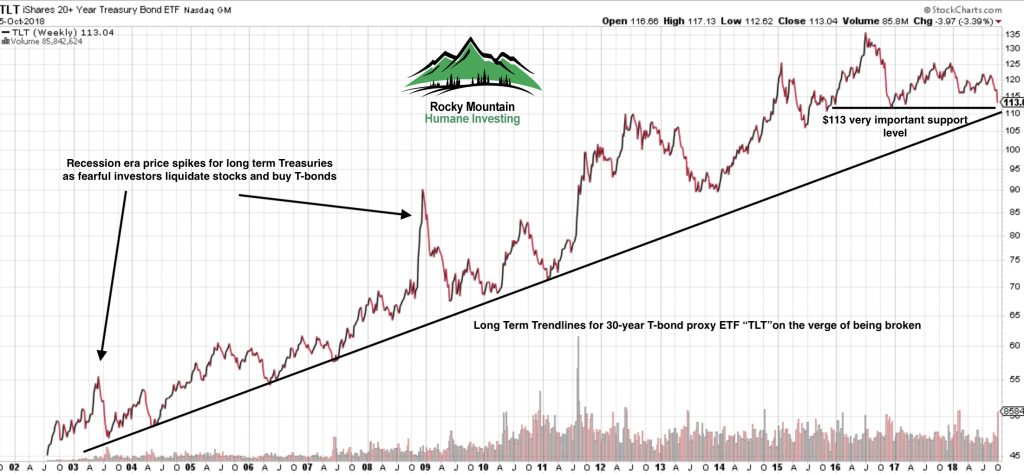
Chart 2: Proxy for the 30-Year T-bond is the TLT. The chart below is inverse to Chart 1 above. Any further weakness with a close below $113 could accelerate the bond sell-off which would trigger more stock market weakness in the short term.
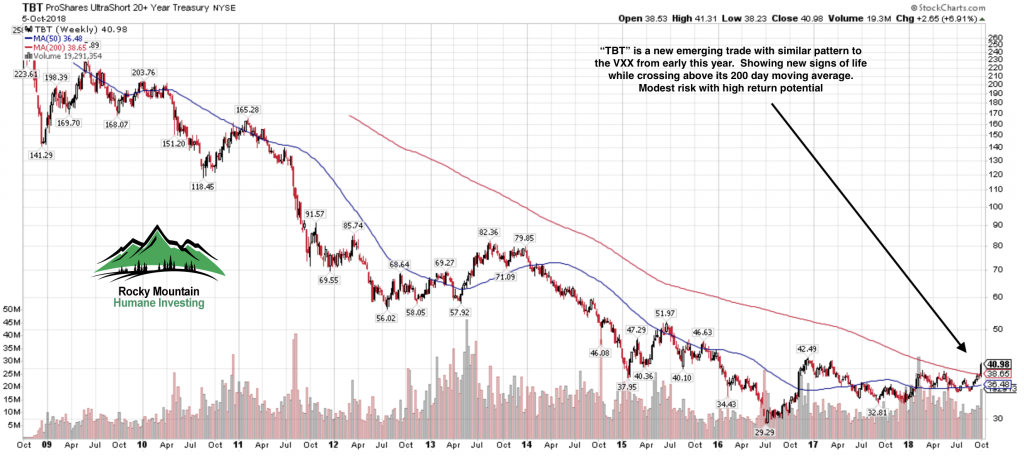
Chart 3: A direct beneficiary of the decline in bond prices is setting itself up for a very good risk/reward trade. As the bond market declines, the TBT will rally higher.
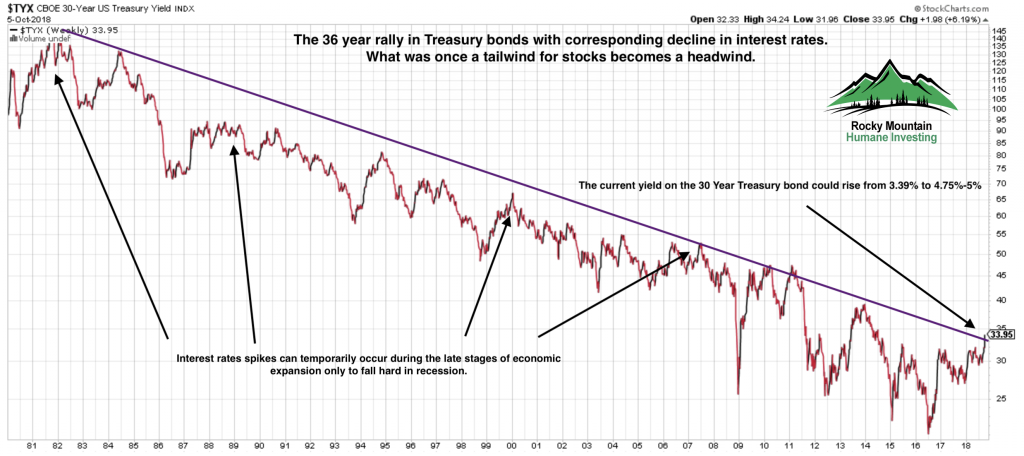
Chart 4: Internal market strength was showing an important discrepancy with the Advance/Decline line which did not confirm the most recent market peak as it should. This non-confirmation gives us a clue that internally at present the stock market is not very healthy and is in need of a purge.
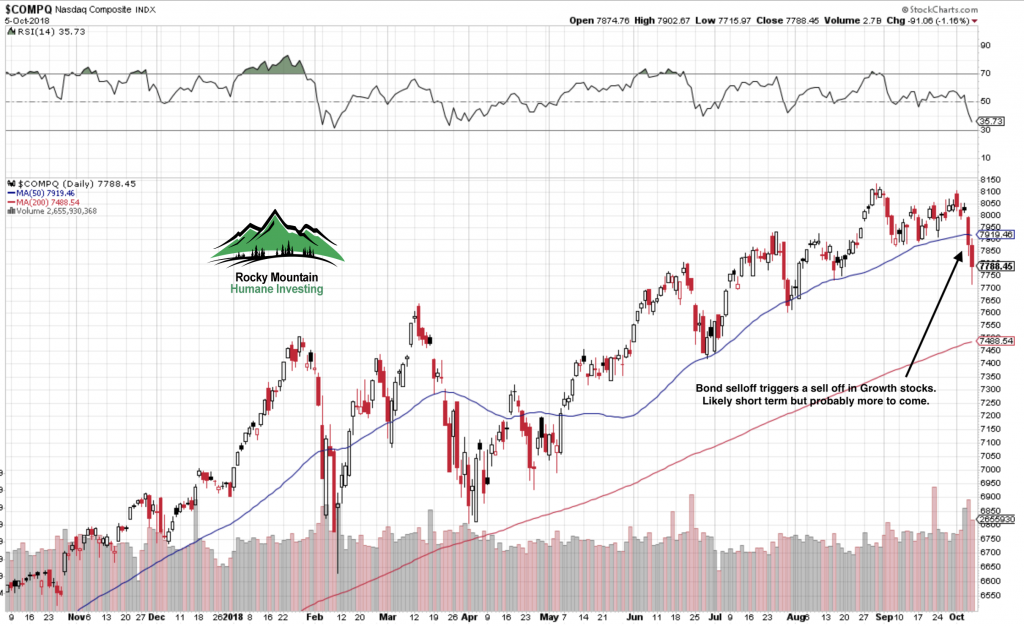
My guess is that the selling is not finished. We may bounce here for a day or two, but if the bond market continues to be weak, the Nasdaq Composite (Chart 5) could visit 7500 or so quickly. Selling would likely be contained at that level. Odds are high this is not the start of a bear market for stocks.
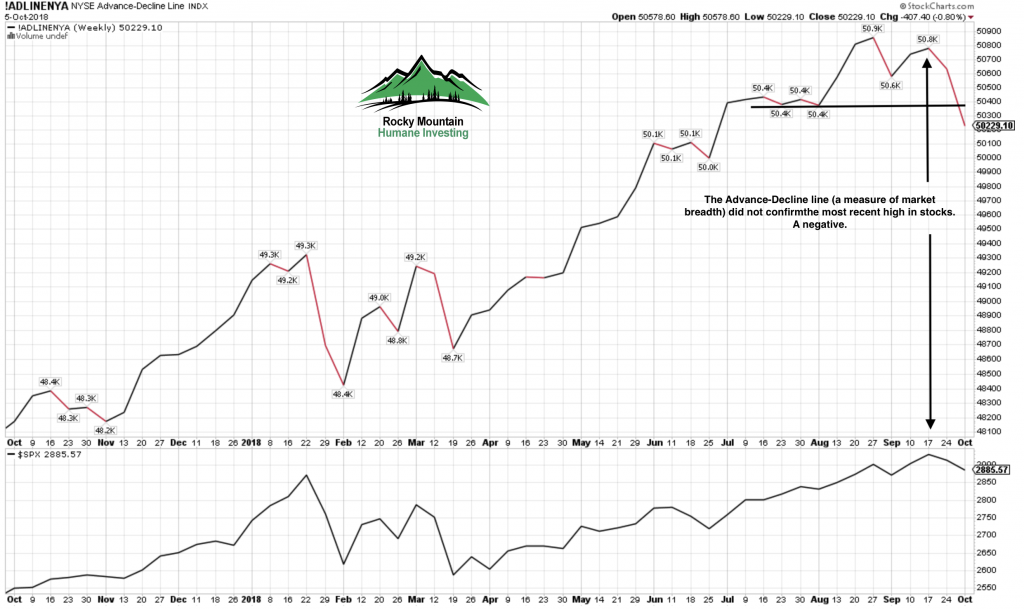
Chart 6: Our long term primary trend indicator remains quite positive at present. Market tops are usually made by a rolling-over process rather than a mountain top peak. See my estimates for business cycle – stock market peak below.
Parlor game guesses for cycle peaks
Based on the Fed’s rate hike projections, we’ll reach inversion by February 2019. The Fed has given no signal to indicate they’ll declare a halt to rate hikes which could push the date to later next year. In fact the most recent jobs data makes me think they’ll hit the brakes hard next year.
So, based on an inversion in February 2019 we can make some recession date assumptions based on the past 9 yield curve inversions dating back to 1957:
The shortest lead time from inversion to recession has been 8 months: October 2019. Median lead time from inversion to recession has been 12 months: February 2020.
Longest lead time from inversion to recession has been 20 months: October 2020.
Understand the recession data is based on NBER declared recessions and they date the start of a recession many months in hindsight. But we can make reasonable estimates based on yield curve inversion dates.
The stock market is a forward looking barometer meaning that the markets look ahead into the future. This means the US stock market will peak and begin to rollover before the recession starts.
Based upon data from 1957, the US stock market has peaked on average 5 months before the start of a recession.
Earliest estimated stock market peak is May 2019. Likeliest estimated stock market peak is September 2019. Latest estimated stock market peak is May 2020.
Thanks again to all of you for your trust. As an investment manager, my goal is to avoid the dogmatic approach, be flexible and neutral to market behavior. Any investor who decides to get into an argument and mansplain to the market will emerged bruised and poorer for the experience.
Since the 10% decline in the S&P 500 index in late January I’ve been using my Bull Market playbook to deal with a decline. Technically speaking we are still in a Bull Market but our Bull status is looking more precarious by the day. The Bull Market playbook means I’m looking for a double bottom or retest of the market lows off the initial sell-off. Secondly, I’d be looking to buy stocks on signs of a successful retest and rally.
Friday’s 2.19% decline was especially disheartening since it wiped out three days of gains. Stocks had been showing signs of recovery by trying to build a base from which to rally. Previously, markets were appeased by the story that the White House was using the tariff threats as a negotiating tool. But Friday’s news showed that markets are not buying that story any more. This is a dangerous and unpredictable situation that leaves any investor unhedged in stocks vulnerable to policy mistakes and reckless statements from the White House or cabinet.
The second leg down rallies have been relatively weak with reduced volume while declines have been larger in magnitude and increased volume (not good). This reveals that large institutional investors are in a liquidation mode and are using rallies to sell rather than using declines to accumulate. This is Bear Market behavior and is giving me pause to reassess the likelihood of another another significant leg down for stocks and the possibility of a Bear Market.
Perhaps this weakness is the aftermath of the parabolic rise in stocks earlier this year? Plus theextreme readings of investor sentiment? It’s possible, but I’d argue that stocks and bonds are now reacting accordingly to an aggressive Federal Reserve and a much higher than average possibility of policy mistakes from the White House.
Chart 1
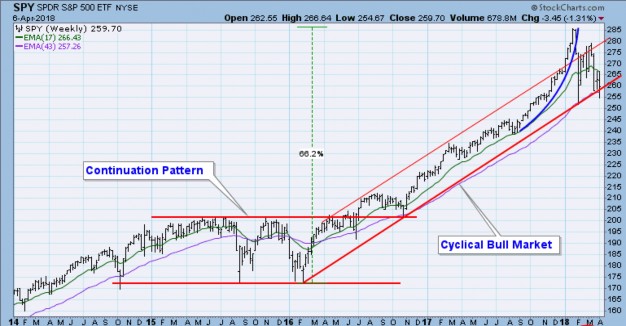
Chart 1 above, courtesy of Carl Swenlin of Decisionpoint, shows the importance of the $257 level for the “SPY” aka S&P 500 ETF. Both the 200 day moving average and the underlying trend line from the 2016 rally converge at nearly the same level.
There are also other important issues the world stock markets are contending with:
The global economic recovery is mature and slowing.Worldwide GDP data is showing clear signs of slowing.
Policy Errors:The tax cuts are the personification of fiscal irresponsibility and there’s no going back.
Trade Wars are “good and easy to win”. Investors aren’t fooled in the least by this rhetoric (seeSmoot-Hawley Tariff Act). We’ve never had a President who can just as easily talk up a stock market and talk it down with rhetoric within weeks. This is certainly a market headwind for stocks.
Chart 2
Aggressive Federal Reserve:The “Yield Curve” (shown above in Chart 2) is growing increasingly negative as short term interest rates are rising which will eventually kill the economic expansion. This causes investors to buy long term Treasury bonds. The higher short term yields and lower long term yield flatten the difference between short and long term rates which reduces the incentive for banks to lend.
The Yield Curve is a simple indicator and one of the most powerful tools to predict markets and the economy. Once the curve drops to .5 its “Goodnight Irene” for stocks and “Good Day Sunshine” for Treasury bonds. This is why we’ve recently added long term Treasury bonds to client portfolios.
If you’d like to learn more about the Yield Curve, there is an array of data from none other than the Federal Reserve:
Our Present Status:A sharp break in the price in Chart 1 below $257 without a rebound implies there is more selling ahead, which could be significant. Since my style of investing is based on reacting rather than predicting, I’d look for a $257 break to increase our existing hedges and further reduce stock holdings.
Should the price break below $257 not occur or occur briefly, I’d keep the status quo but expect the bottoming process to take longer than expected. I’d likely prefer to reduce stock holdings in strength until we see a positive change in market behavior.
Treasury bonds:My W.A.G. for Treasury Bonds and the economy is that the Yield Curve inverts in 2019 which will cause a full blown bear market in stocks and bull market in Treasury bonds. T-bonds could rally by more than 20% due to the reduced effect of lowering interest rates in an already low rate environment by the Fed. This could be followed by recession and bear market low by 2020.
Bottom Line:I’m agnostic to market direction as we can generate profits in accounts regardless of market trends. It’s the transition periods which we are possibly in that are tricky to assess. Once a new trend emerges, be it up or down, I’ll adapt and do my best to continue generating profits on your behalf.
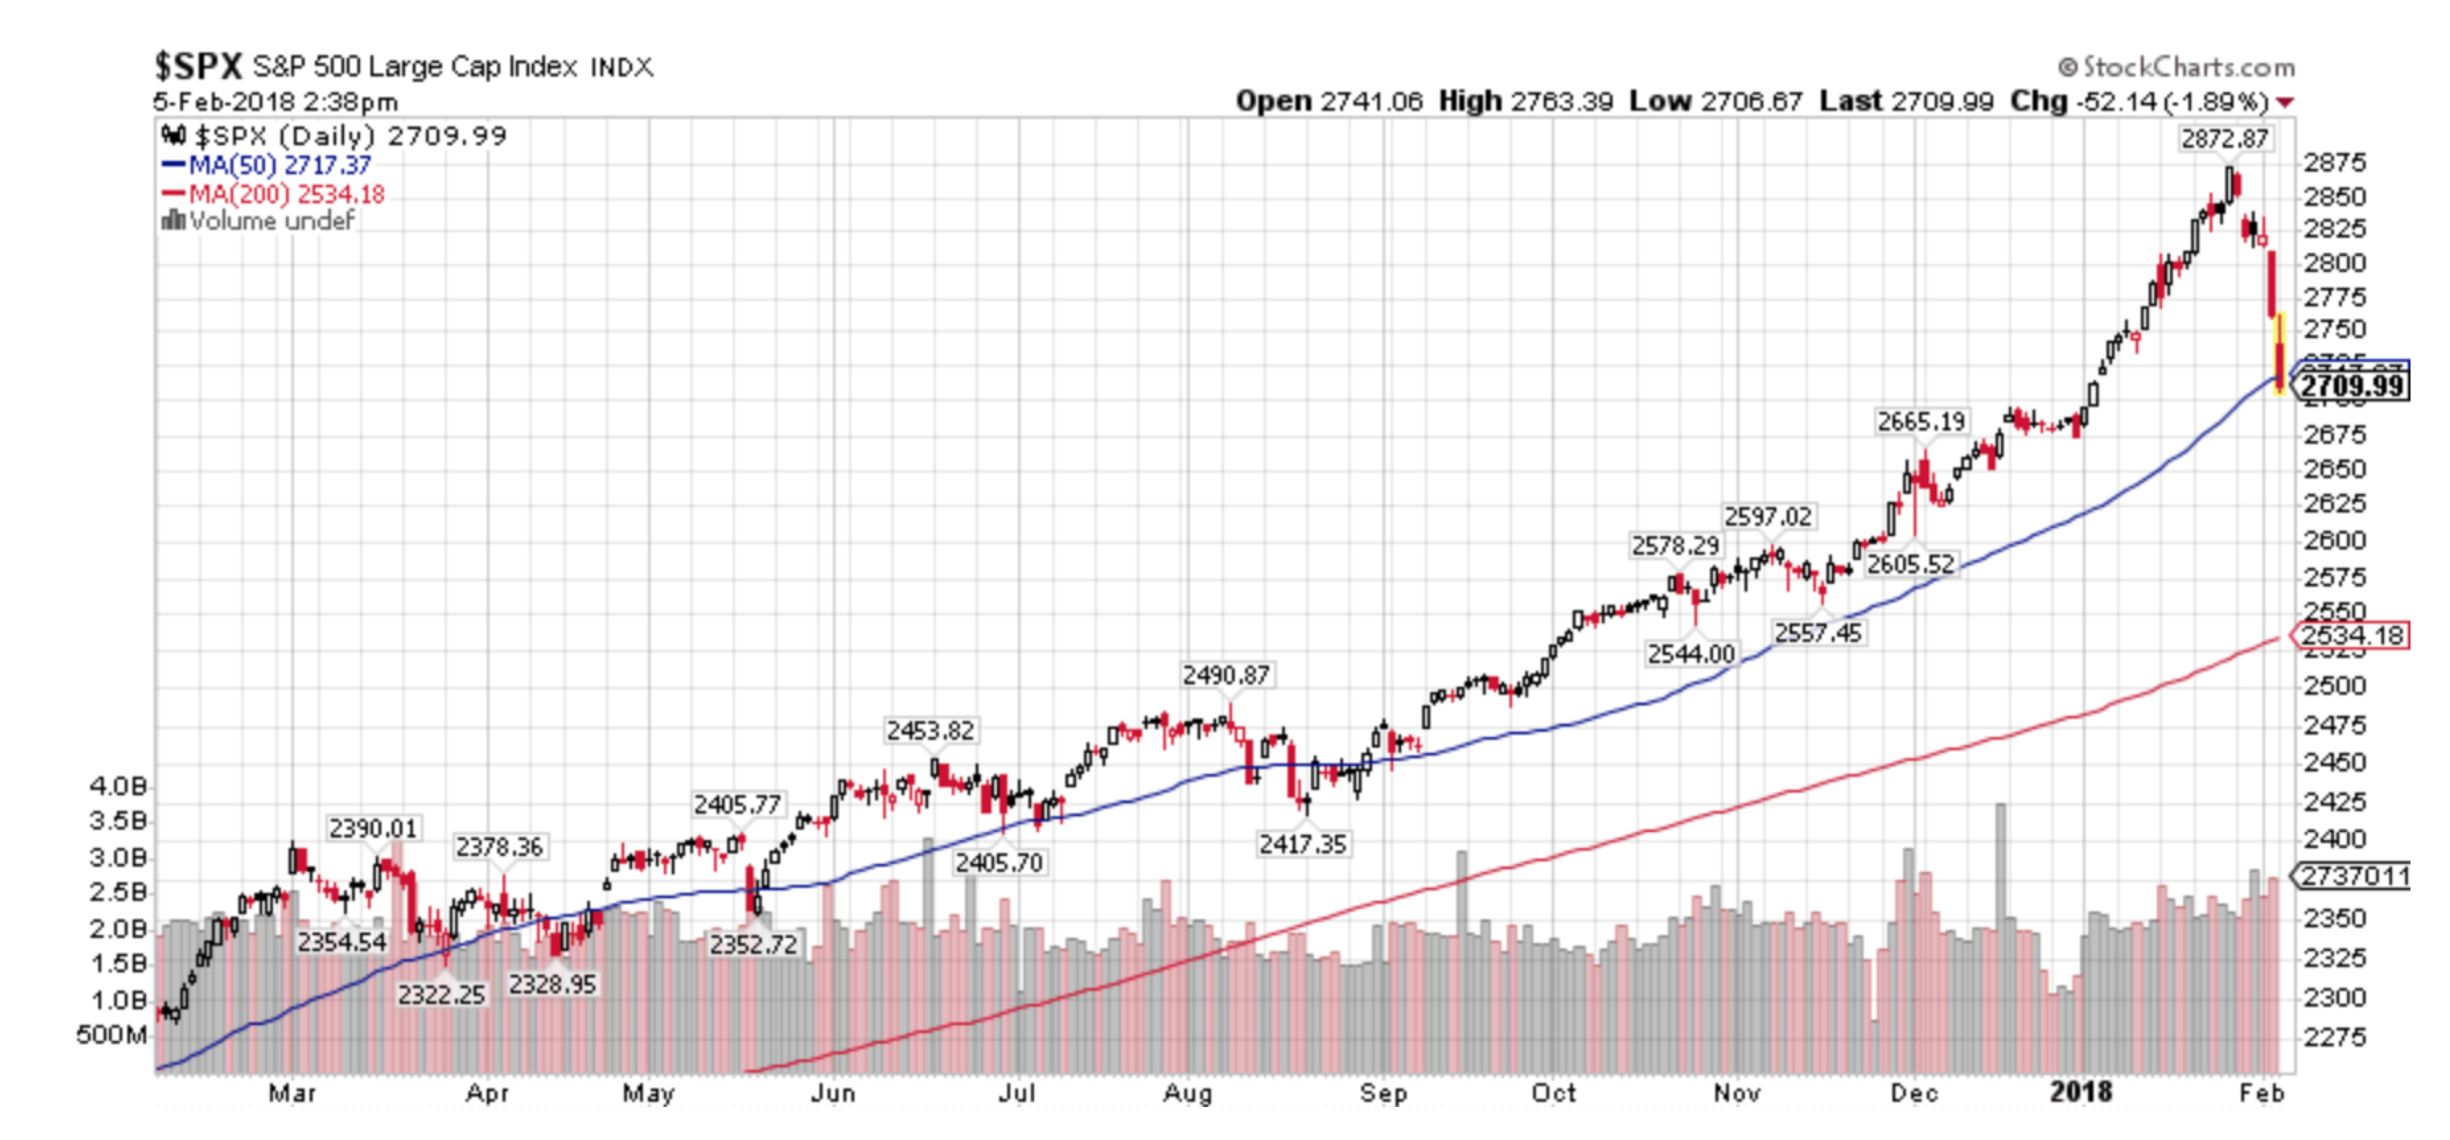
It has certainly been a wild three weeks after a peak to trough -11.8% decline in the S&P 500.
As we’ve been saying in our blog https://www.greeninvestment.com/blog/, during January we were trying to factor in the effect of emerging strength in the VXX along with rising interest rates due to a weak bond market. If you add to this a parabolic move in US equities, I felt that stocks could sell off sharply, which they did.
For our clients (which is reflected in our collective2.com model portfolio), we sold off approximately 40% of our equity holdings and added a 10% “hedge” by buying the emerging VXX to offset potential stock market losses should the decline occur. The downside to adding a suitable hedge to a portfolio is: should the market continue to rise any gains would be relatively muted or non-existent. I consider that a small price to pay to reduce potential risk and volatility.
To quote super investor Paul Tudor Jones: “The most important rule of trading is to play great defense, not offense.”
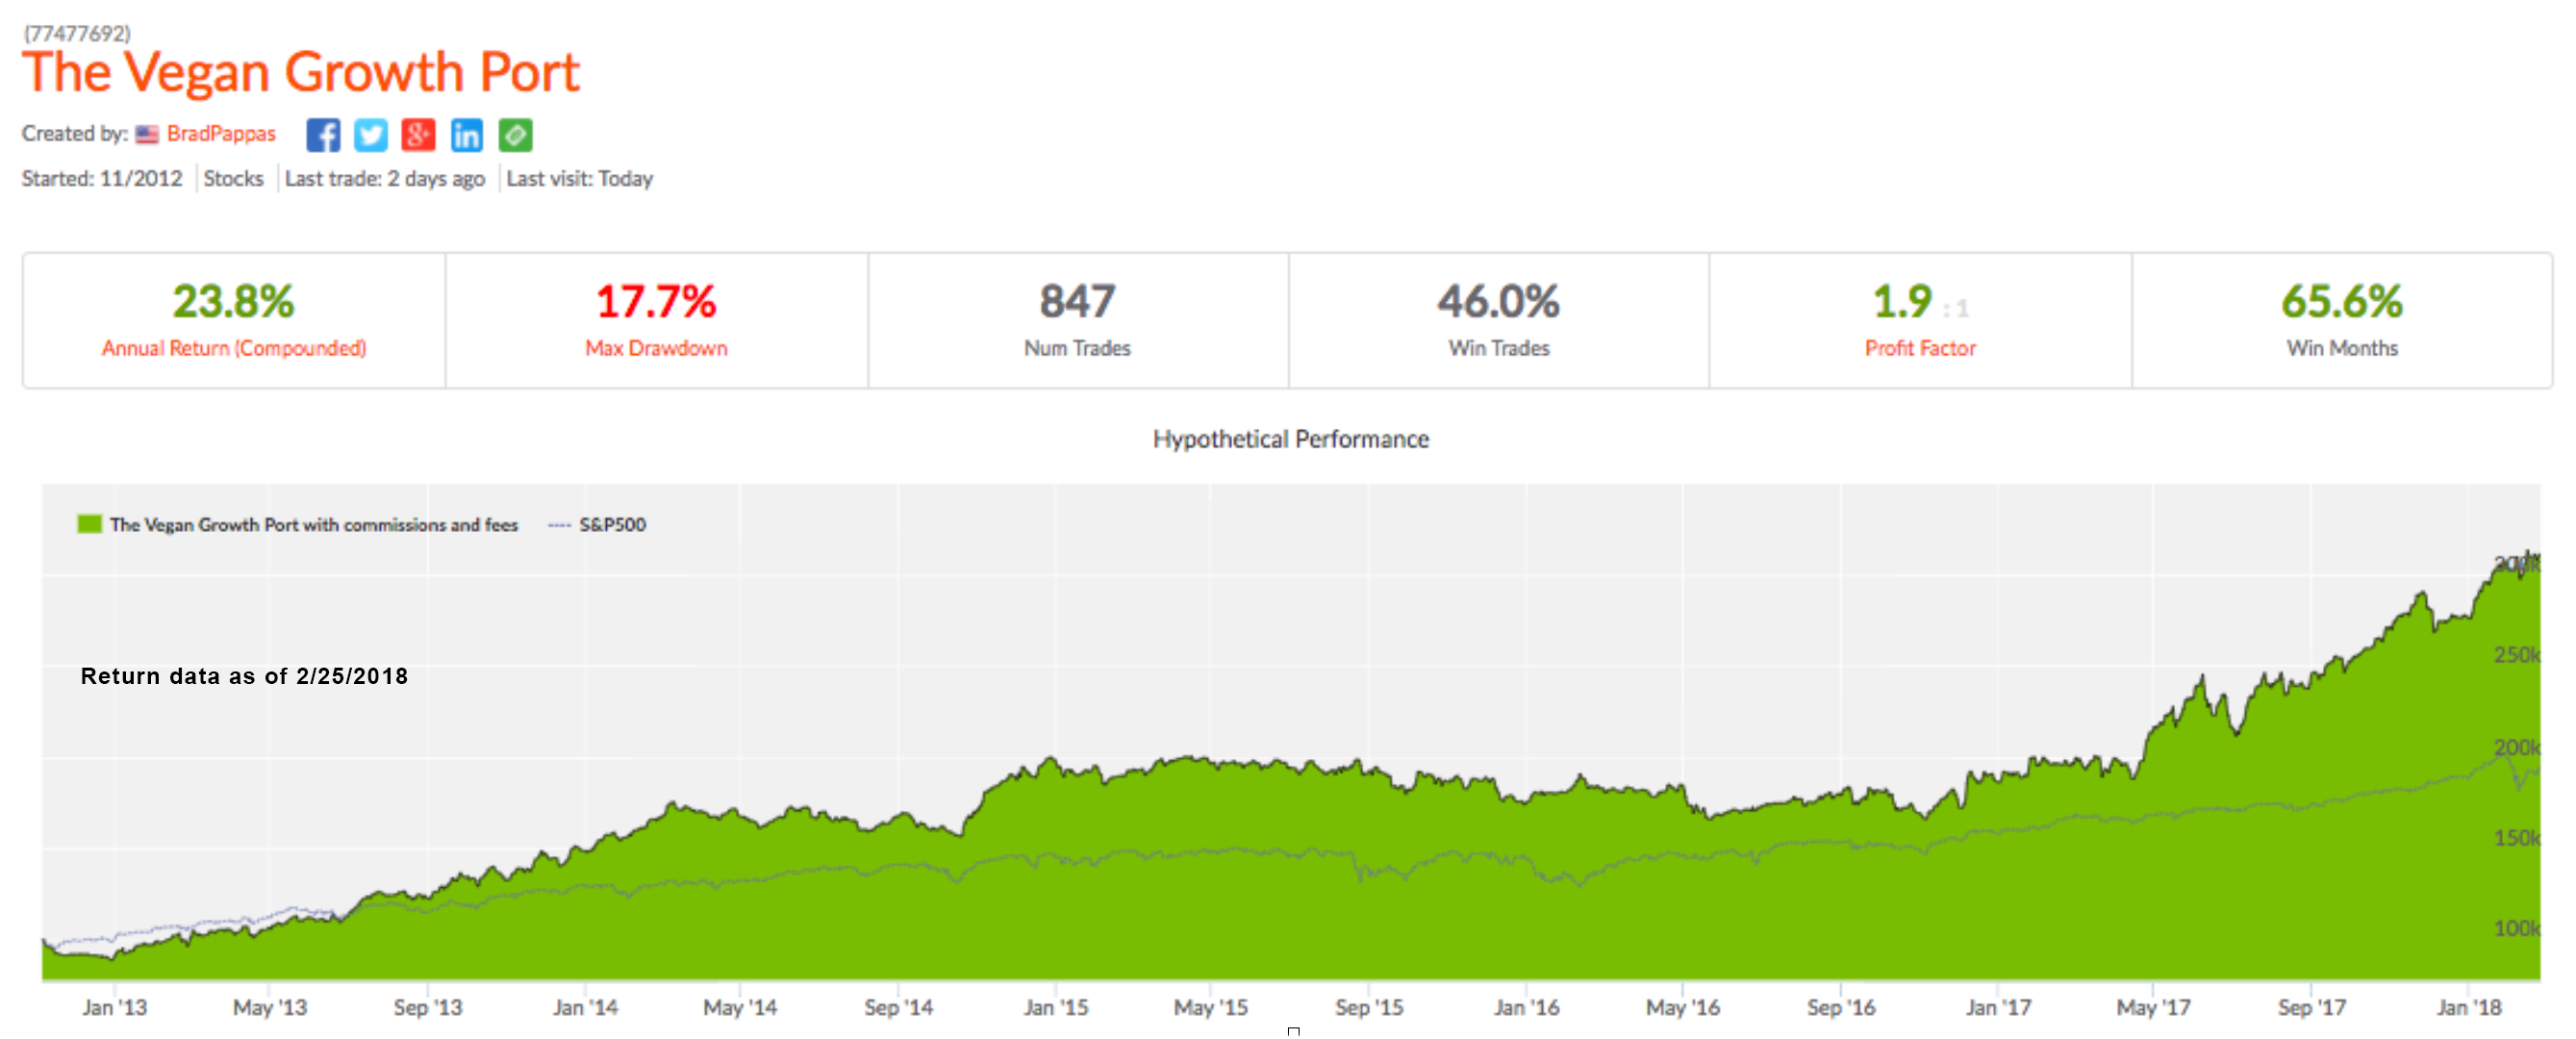
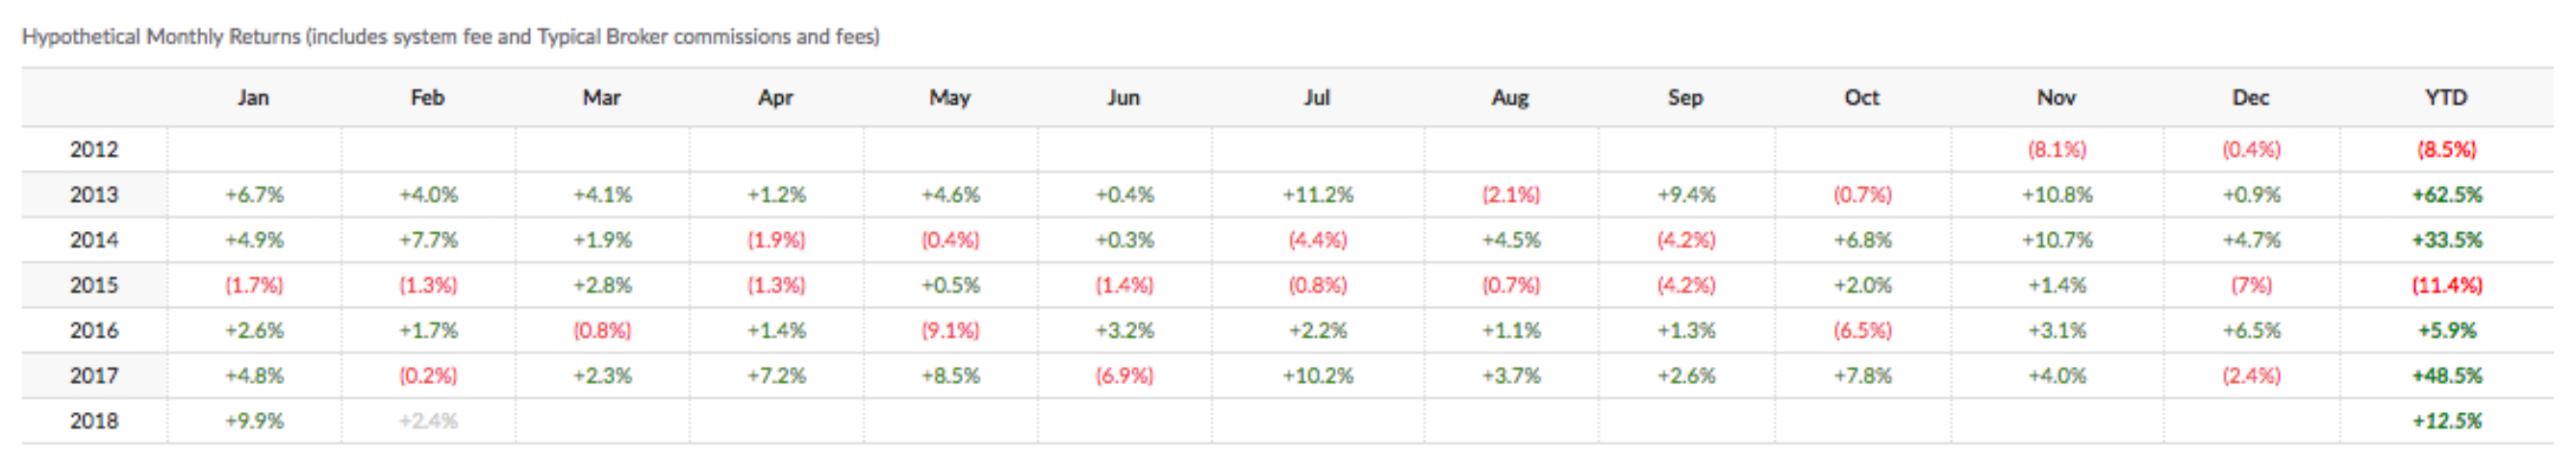
Client portfolios held their value and the Vegan Growth Portfolio model shows a positive gain for the year of 12.5% (net of all fees and expenses) versus 1.5% for the S&P 500.
A good advisor or investment manager should be paying attention to the many moving parts that could affect their client portfolios. In this instance, we were able to successfully anticipate the sell-off. That won’t always be the case and sometimes we’ll be wrong as well. I think it’s critically important for the long term success of our clients to act when we think the odds are good that we’re entering a high risk period.
The information provided here is for general informational purposes only and should not be considered an individualized recommendation or personalized investment advice. The investment strategies mentioned here may not be suitable for everyone. Each investor needs to review an investment strategy for his or her own particular situation before making any investment decision. All expressions of opinion are subject to change without notice in reaction to shifting market, economic or political conditions. Data contained herein from third party providers is obtained from what are considered reliable sources. However, its accuracy, completeness or reliability cannot be guaranteed. Past performance is no guarantee of future results.
A quick update as to the happenings of the last week and a half and what to expect going forward.
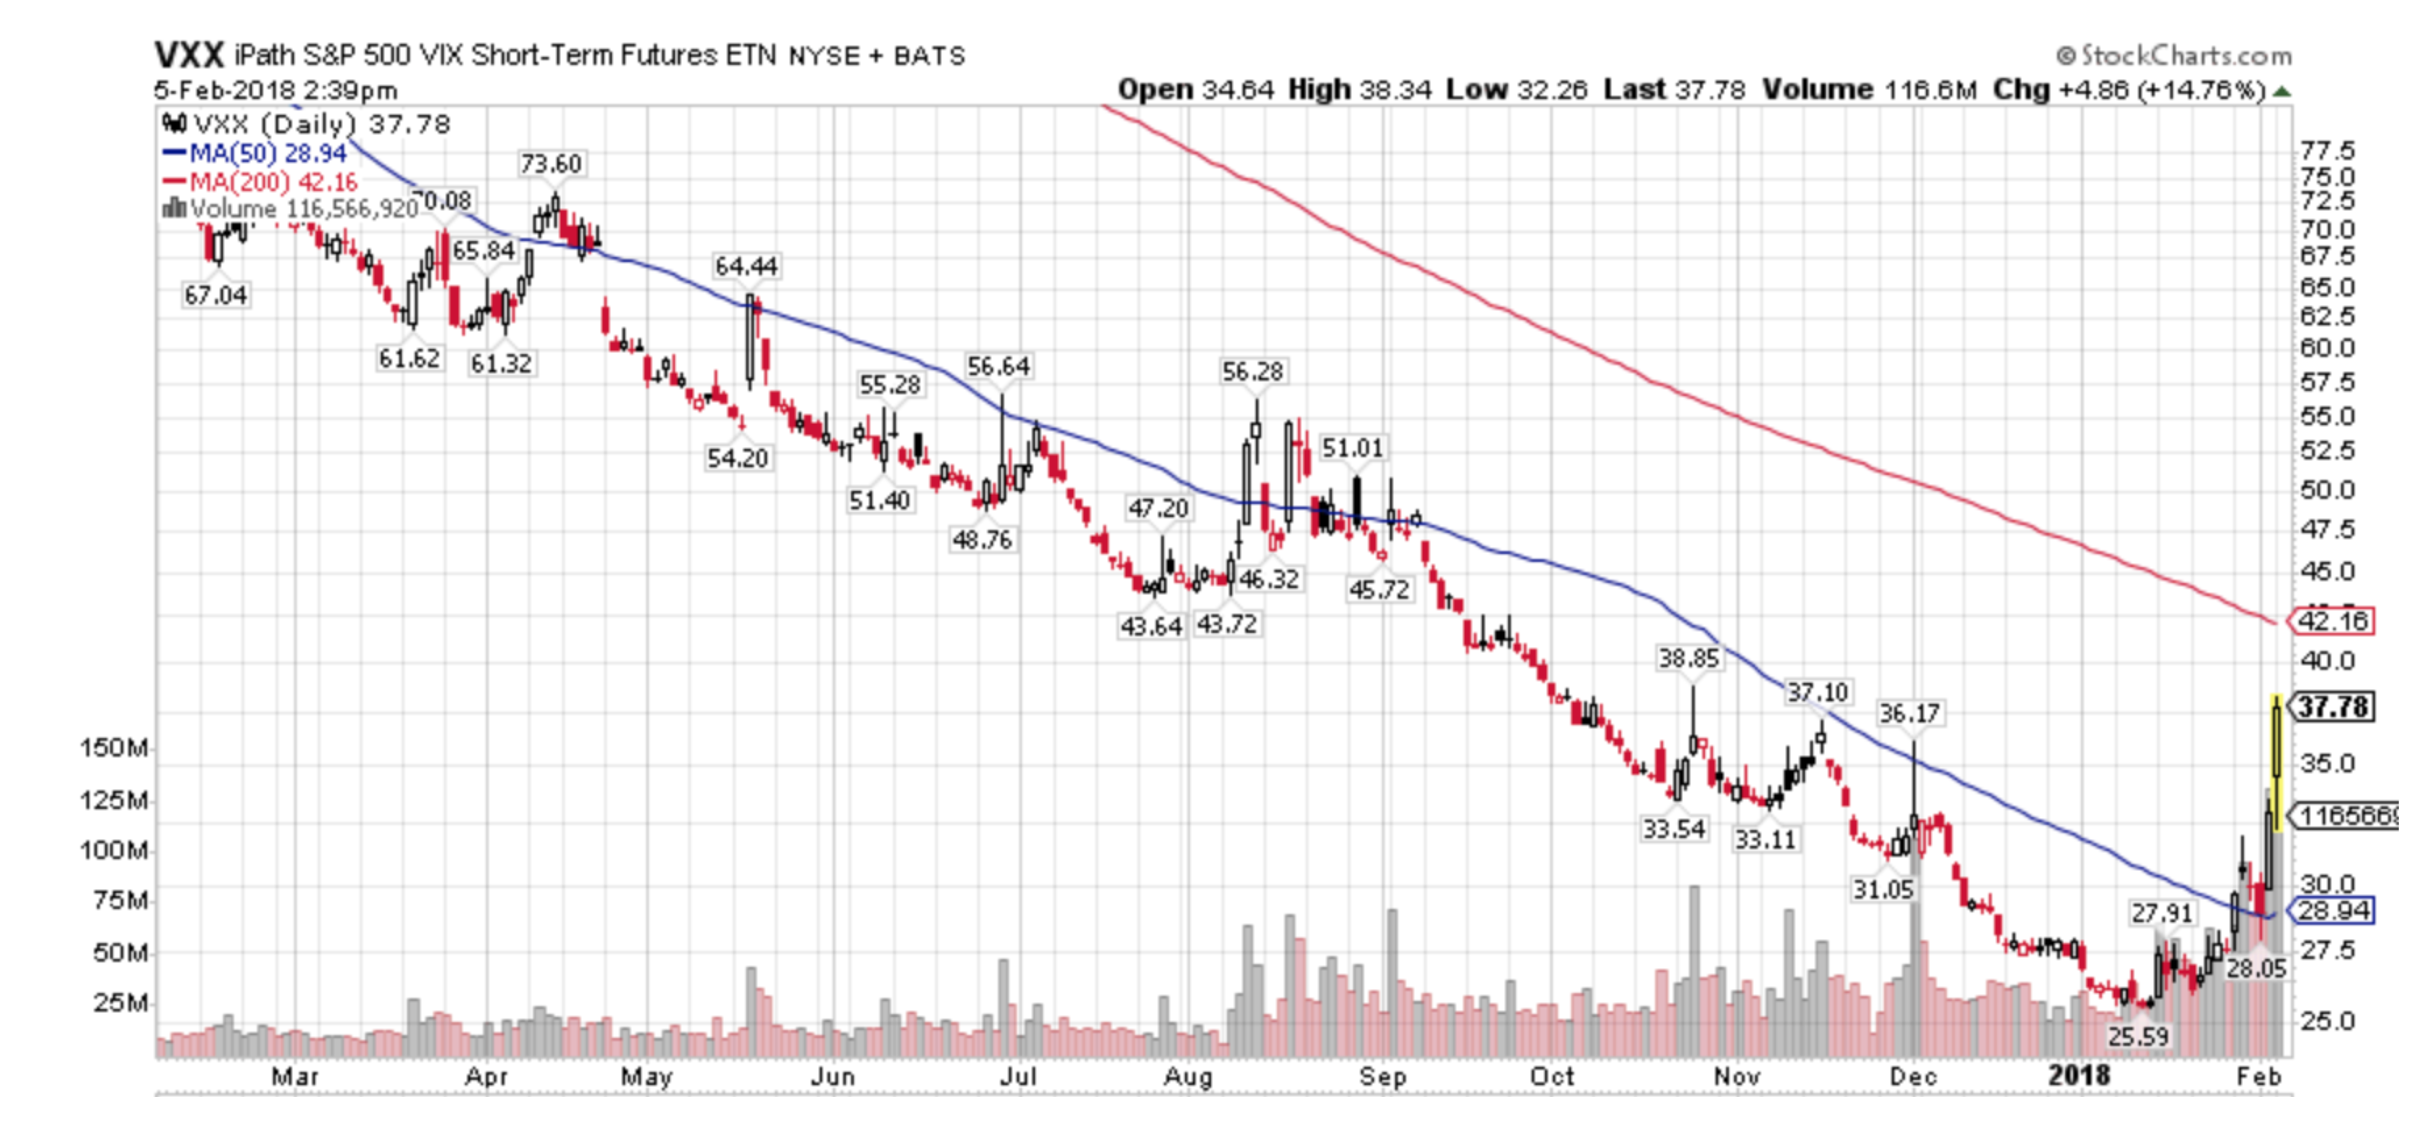
Paraphrasing Mae West’s “Too much of a good thing…is a good thing”, until it isn’t. In my early January letter I mentioned two events to look for: 1) a rise in interest rates and 2) the bursting of the low-volatility bubble. I wouldn’t have expected for both of them to come to fruition within a matter of days but that’s what happened.
The stock market vaulted into Parabolic mode in January and that’s a great thing until the music ends but by last Friday I had seen enough. On Friday 1/26 I began to sell heavily and adding the first round of what I expected to be a good “hedge”. The following Monday I sold off more holdings and increased our hedge to approximately 10%-15% or so of account size. I suspected the end of the parabolic rise or the market top was close, but it literally was those two days of selling.
The “Hedge” I utilized and as seen in your position statement at IB or Schwab is the “VXX” which is an exchange traded note based on the volatility measure known as the VIX. The VIX and VXX rise as market volatility rises. And, as a rule market volatility almost always rises as markets sell off. Since volatility had been declining for almost three years we were finally due for its return. I’ll never be known as a patient person but I had been sitting on this VXX trade for about six months. The Low-Volatility trade got so stupid that on my collective2.com platform there were people developing Low Vol trading accounts called “10% per month”. They must be kin to the Bitcoin “millionaires”. Eventually all things financial revert to their mean averages and volatility is no exception.
Last week I began buying the VXX in the $27.5 range and the close today was at $32.18. Today I sold approximately 25% of our hedges / VXX at the end of the day in the range of $31 as I expect a wicked bounce higher next week.
February 5 update: Another very steep decline today. I saw -1500 on the Dow at one point. We haven’t seen than in a few years and I sold off another layer of VXX into the abyss. These are the golden moments to lighten up on our hedges since the VXX price will drop sharply in a rally.
All in all, the rise in the VXX has been more than enough to balance off any losses in our remaining holdings. This morning’s weakness was expected as the retail investor tends to panic over the weekends and frequently sells at any price on Monday mornings. But this afternoon’s selloff looks like pure panic. Markets tend to make bottoms during moments like this.
So far nothing I’ve seen leads me to think the long term bull market is over. The damage being done now will generate a great deal of fear and selling which will be the fuel for the next leg higher in this market. I do believe we’ll revisit the highs by the end of the year unless there is a total breakdown in prices and trend. We’ll need to see a lot more selling and weakness to break the long term trend.
For the balance of the week I do expect at least a couple days of strong rallying which is why I continue to slowly sell our VXX into more weakness. These will be simple knee jerk rallies that don’t mean much. The market bottoming will be a process of market rally’s and sell offs that could take upward of a month or two. There is no need to rush back and buy stocks at this point.
Best of all, we’re sitting on a very large amount of cash in all accounts ready to buy at the right moment. One of the biggest values of proper hedging is the calm it can create which allows for clear thinking in chaotic markets.