The Post Parabolic Blues
4/8/2018
Since the 10% decline in the S&P 500 index in late January I’ve been using my Bull Market playbook to deal with a decline. Technically speaking we are still in a Bull Market but our Bull status is looking more precarious by the day. The Bull Market playbook means I’m looking for a double bottom or retest of the market lows off the initial sell-off. Secondly, I’d be looking to buy stocks on signs of a successful retest and rally.
Friday’s 2.19% decline was especially disheartening since it wiped out three days of gains. Stocks had been showing signs of recovery by trying to build a base from which to rally. Previously, markets were appeased by the story that the White House was using the tariff threats as a negotiating tool. But Friday’s news showed that markets are not buying that story any more. This is a dangerous and unpredictable situation that leaves any investor unhedged in stocks vulnerable to policy mistakes and reckless statements from the White House or cabinet.
The second leg down rallies have been relatively weak with reduced volume while declines have been larger in magnitude and increased volume (not good). This reveals that large institutional investors are in a liquidation mode and are using rallies to sell rather than using declines to accumulate. This is Bear Market behavior and is giving me pause to reassess the likelihood of another another significant leg down for stocks and the possibility of a Bear Market.
Perhaps this weakness is the aftermath of the parabolic rise in stocks earlier this year? Plus the extreme readings of investor sentiment? It’s possible, but I’d argue that stocks and bonds are now reacting accordingly to an aggressive Federal Reserve and a much higher than average possibility of policy mistakes from the White House.
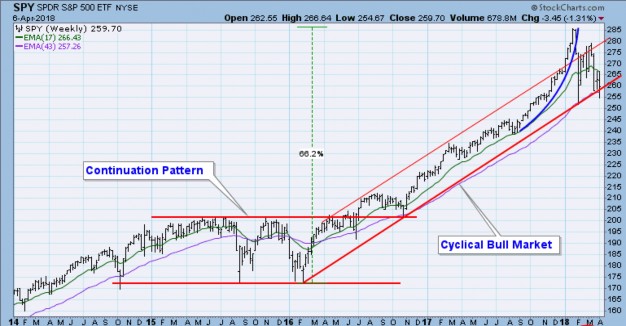
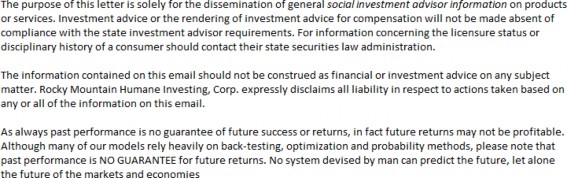
Chart 1
Chart 1 above, courtesy of Carl Swenlin of Decisionpoint, shows the importance of the $257 level for the “SPY” aka S&P 500 ETF. Both the 200 day moving average and the underlying trend line from the 2016 rally converge at nearly the same level.
There are also other important issues the world stock markets are contending with:
The global economic recovery is mature and slowing. Worldwide GDP data is showing clear signs of slowing.
Policy Errors: The tax cuts are the personification of fiscal irresponsibility and there’s no going back.
Trade Wars are “good and easy to win”. Investors aren’t fooled in the least by this rhetoric (see Smoot-Hawley Tariff Act). We’ve never had a President who can just as easily talk up a stock market and talk it down with rhetoric within weeks. This is certainly a market headwind for stocks.
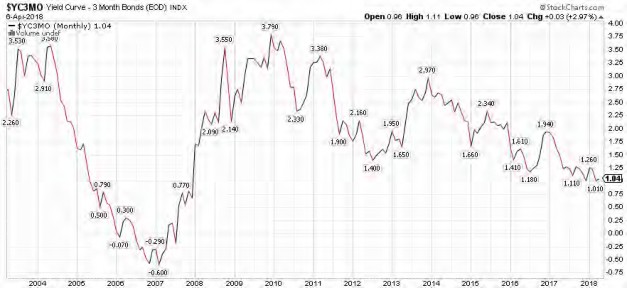
Chart 2
Aggressive Federal Reserve: The “Yield Curve” (shown above in Chart 2) is growing increasingly negative as short term interest rates are rising which will eventually kill the economic expansion. This causes investors to buy long term Treasury bonds. The higher short term yields and lower long term yield flatten the difference between short and long term rates which reduces the incentive for banks to lend.
The Yield Curve is a simple indicator and one of the most powerful tools to predict markets and the economy. Once the curve drops to .5 its “Goodnight Irene” for stocks and “Good Day Sunshine” for Treasury bonds. This is why we’ve recently added long term Treasury bonds to client portfolios.
If you’d like to learn more about the Yield Curve, there is an array of data from none other than the Federal Reserve:
https://www.clevelandfed.org/our-research/indicators-and-data/yield-curve- and-gdp-growth.aspx
Our Present Status: A sharp break in the price in Chart 1 below $257 without a rebound implies there is more selling ahead, which could be significant. Since my style of investing is based on reacting rather than predicting, I’d look for a $257 break to increase our existing hedges and further reduce stock holdings.
Should the price break below $257 not occur or occur briefly, I’d keep the status quo but expect the bottoming process to take longer than expected. I’d likely prefer to reduce stock holdings in strength until we see a positive change in market behavior.
Treasury bonds: My W.A.G. for Treasury Bonds and the economy is that the Yield Curve inverts in 2019 which will cause a full blown bear market in stocks and bull market in Treasury bonds. T-bonds could rally by more than 20% due to the reduced effect of lowering interest rates in an already low rate environment by the Fed. This could be followed by recession and bear market low by 2020.
Bottom Line: I’m agnostic to market direction as we can generate profits in accounts regardless of market trends. It’s the transition periods which we are possibly in that are tricky to assess. Once a new trend emerges, be it up or down, I’ll adapt and do my best to continue generating profits on your behalf.
Thank you,
Brad Pappas
Hello All
A quick update as to the happenings of the last week and a half and what to expect going forward.
Paraphrasing Mae West’s “Too much of a good thing…is a good thing”, until it isn’t. In my early January letter I mentioned two events to look for: 1) a rise in interest rates and 2) the bursting of the low-volatility bubble. I wouldn’t have expected for both of them to come to fruition within a matter of days but that’s what happened.
The stock market vaulted into Parabolic mode in January and that’s a great thing until the music ends but by last Friday I had seen enough. On Friday 1/26 I began to sell heavily and adding the first round of what I expected to be a good “hedge”. The following Monday I sold off more holdings and increased our hedge to approximately 10%-15% or so of account size. I suspected the end of the parabolic rise or the market top was close, but it literally was those two days of selling.
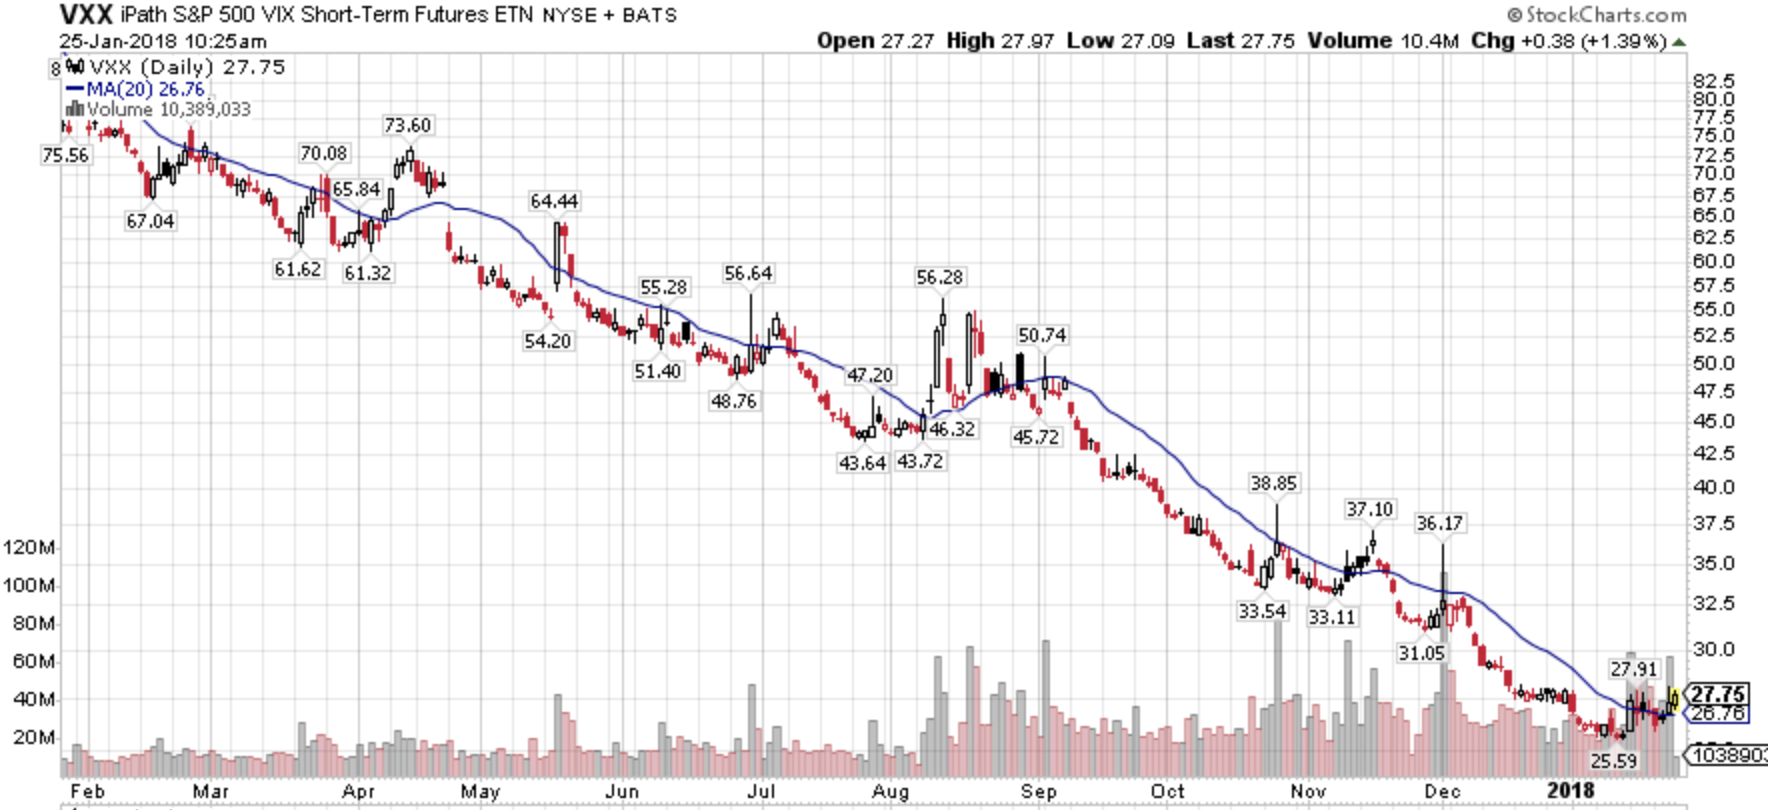
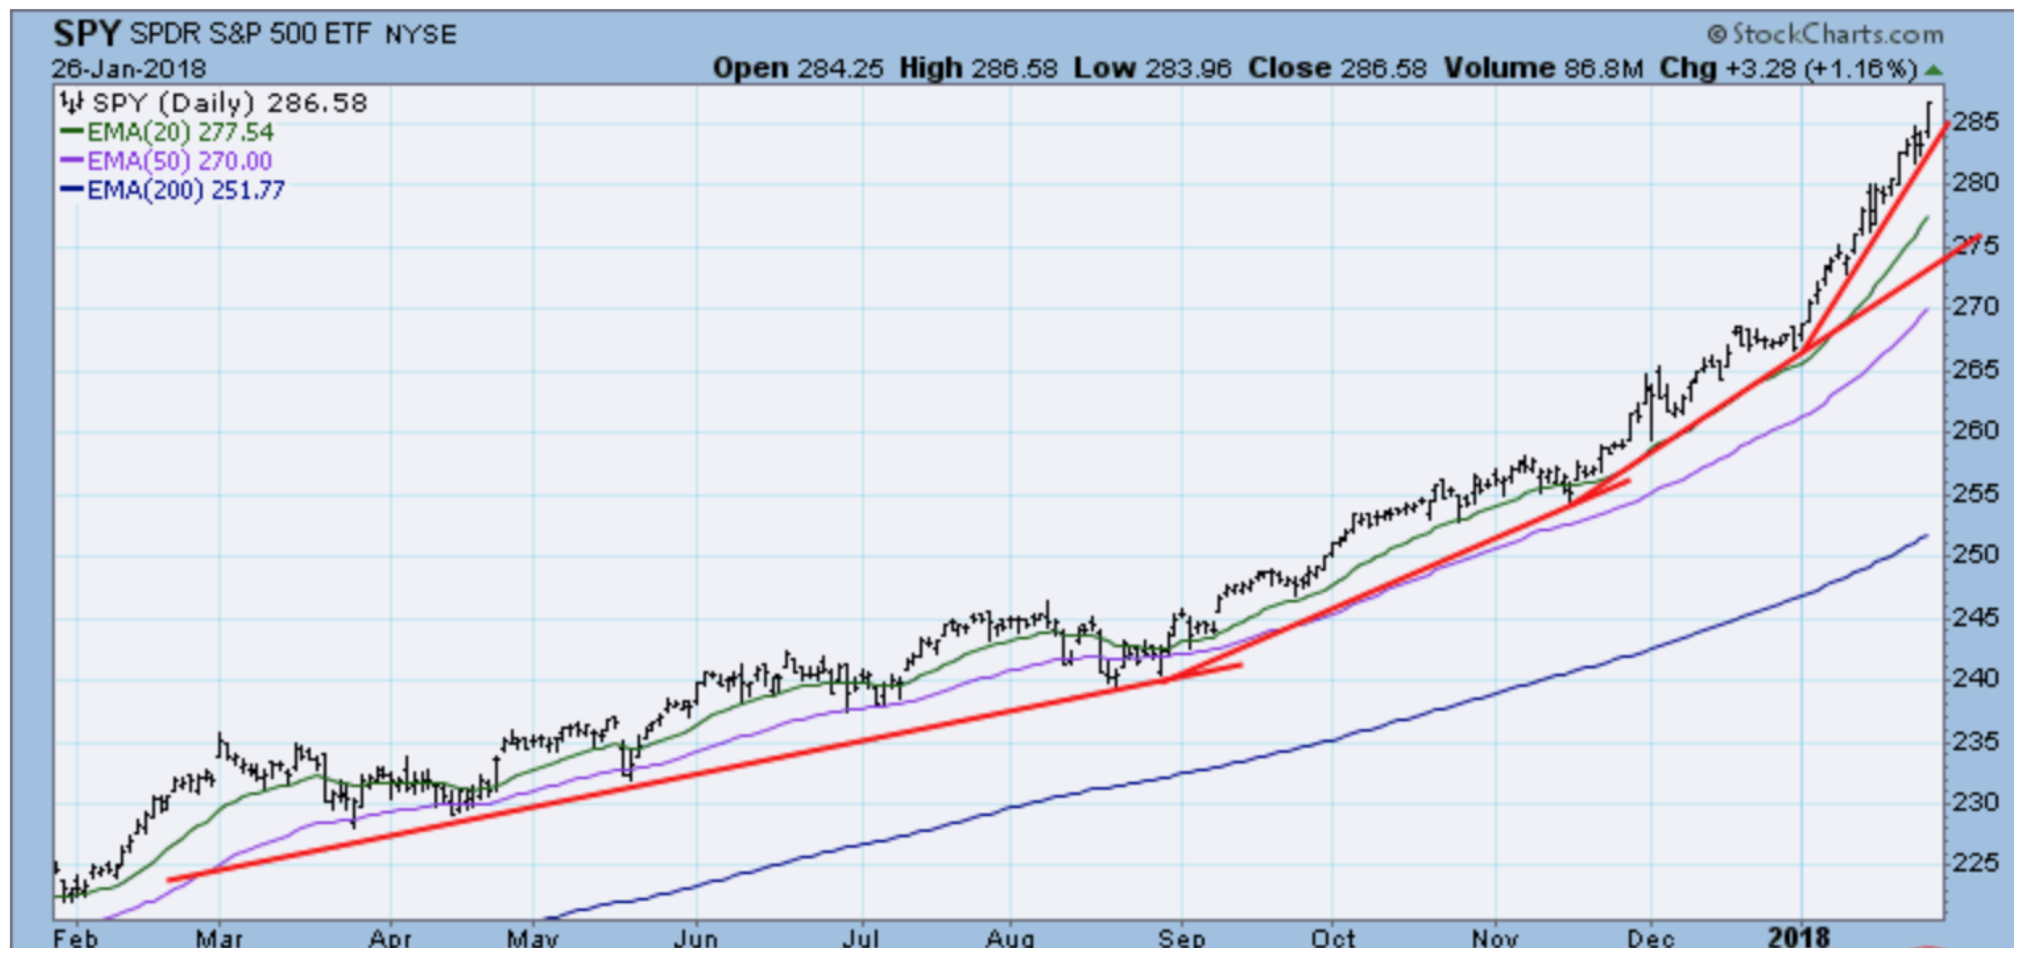
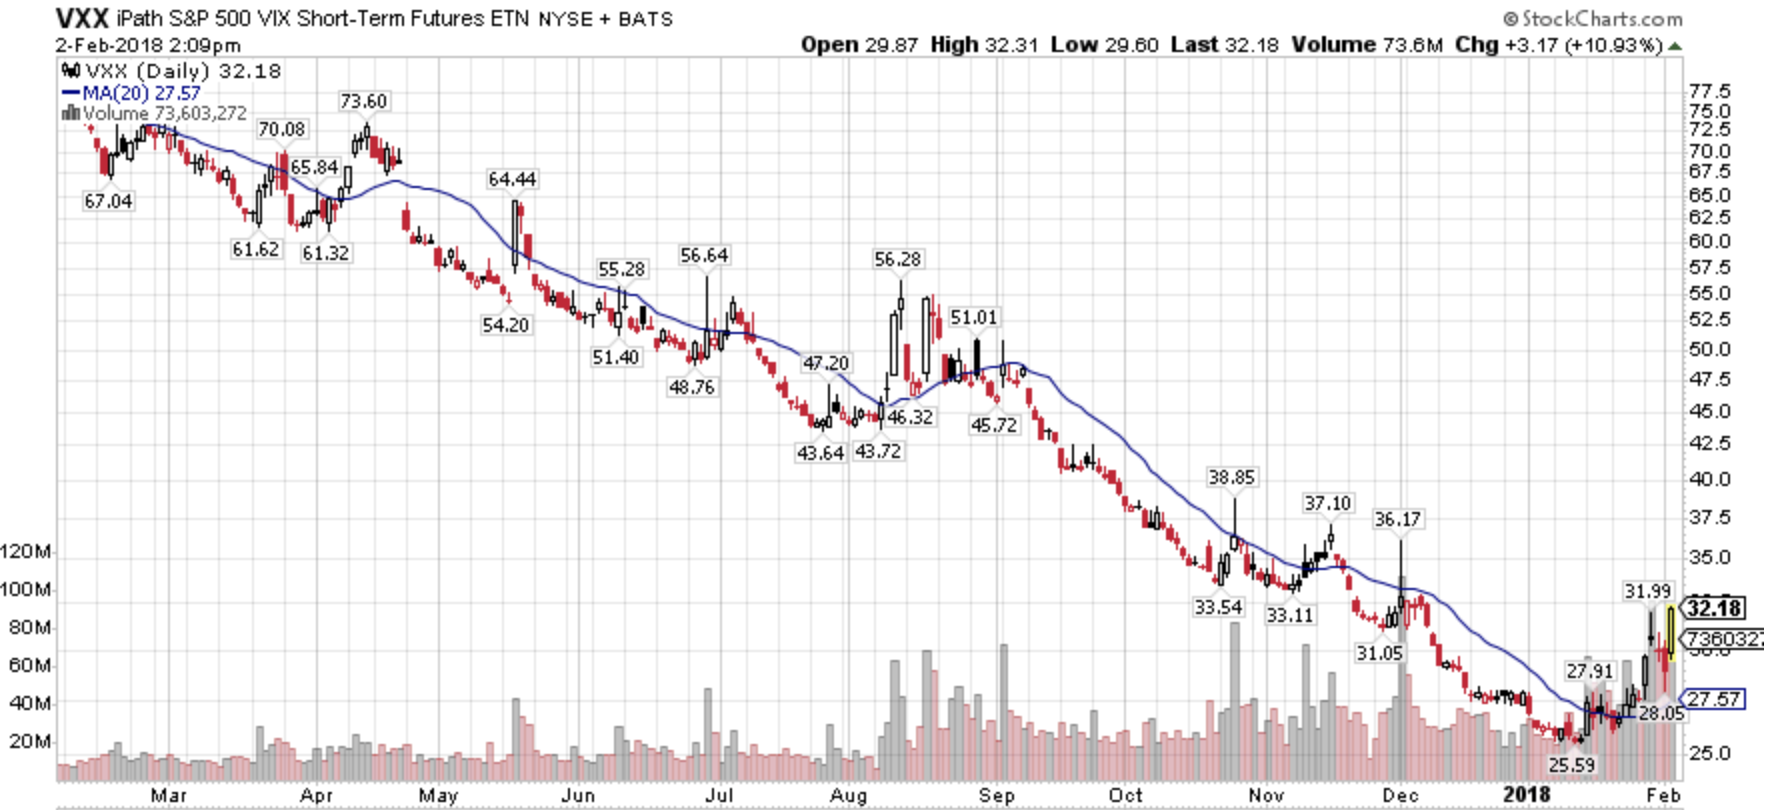
The “Hedge” I utilized and as seen in your position statement at IB or Schwab is the “VXX” which is an exchange traded note based on the volatility measure known as the VIX. The VIX and VXX rise as market volatility rises. And, as a rule market volatility almost always rises as markets sell off. Since volatility had been declining for almost three years we were finally due for its return. I’ll never be known as a patient person but I had been sitting on this VXX trade for about six months. The Low-Volatility trade got so stupid that on my collective2.com platform there were people developing Low Vol trading accounts called “10% per month”. They must be kin to the Bitcoin “millionaires”. Eventually all things financial revert to their mean averages and volatility is no exception.
Last week I began buying the VXX in the $27.5 range and the close today was at $32.18. Today I sold approximately 25% of our hedges / VXX at the end of the day in the range of $31 as I expect a wicked bounce higher next week.
February 5 update: Another very steep decline today. I saw -1500 on the Dow at one point. We haven’t seen than in a few years and I sold off another layer of VXX into the abyss. These are the golden moments to lighten up on our hedges since the VXX price will drop sharply in a rally.
All in all, the rise in the VXX has been more than enough to balance off any losses in our remaining holdings. This morning’s weakness was expected as the retail investor tends to panic over the weekends and frequently sells at any price on Monday mornings. But this afternoon’s selloff looks like pure panic. Markets tend to make bottoms during moments like this.
So far nothing I’ve seen leads me to think the long term bull market is over. The damage being done now will generate a great deal of fear and selling which will be the fuel for the next leg higher in this market. I do believe we’ll revisit the highs by the end of the year unless there is a total breakdown in prices and trend. We’ll need to see a lot more selling and weakness to break the long term trend.
For the balance of the week I do expect at least a couple days of strong rallying which is why I continue to slowly sell our VXX into more weakness. These will be simple knee jerk rallies that don’t mean much. The market bottoming will be a process of market rally’s and sell offs that could take upward of a month or two. There is no need to rush back and buy stocks at this point.
Best of all, we’re sitting on a very large amount of cash in all accounts ready to buy at the right moment. One of the biggest values of proper hedging is the calm it can create which allows for clear thinking in chaotic markets.
Cheers,
Brad Pappas
VXX continues to rise which implies further stock market weakness. Long VXX
Recently I’ve seen a few studies and charts on Twitter that lend favor to Tax Efficient Investing. These are portfolios where each holding is designed to be held for more than one year. This stragegy allows them to qualify for reduced taxes as a Long Term Capital Gain. The articles I’ve seen generally advocated by financial planners and advisors who see Tax Efficient Investing as their way to add value or have an edge for the clients of their practice. But not once have I seen a credible article playing the role of Devil’s Advocate for Tax Efficient Portfolios. Today the Dow Jones Index was down 660 points at mid-day. It would seem apropos to highlight a few of the disadvantages of Tax Efficient Investing.
The points I will make are from the perspective of a Growth-oriented investment advisor whose primary investment vehicles are stocks, ETF’s and ETN’s. Municipal bonds are a different animal altogether and not the subject of this blog post.
Are the lower taxes worth the losses?
The primary objective of Tax Efficient Investing is to own an investment for at least 12 months. Our primary objection to this strategy is prioritizing time of ownership over gains. Investment gains can disappear or be significantly reduced by the goal of hanging on for one year. For example, you buy a stock at $50 on January 1, 2017 and perhaps by April 2017 the stock is $65. But by January 2, 2018 the stock could be anywhere. A major sin of investing that you open yourself up to is not taking the gain in April. If the market goes into a sell-off where the stock goes back to $50 or below, your gain has been negated. It reminds me a bit of the game show “Let’s Make A Deal” with Monty Hall. Monty would offer a contestant a sure deal right off the bat, but with the caveat of “Would you be willing to give up the sure deal for whats behind Door 1”. It could be a brand new living room or dinette set (hey I watched it in the 1970’s). It could also be a rusting bucket of used auto parts. At that point Monty would offer the bizarrely dressed contestant the consolation prize of the home version of the game show. Cue sad trombone.
The stock could also have gone to $75 in good market as well, up 50%. If the stock continues to rise without any major setbacks, an experienced Trend Following methodology as well as a Tax Efficient investor would likely continue holding on to the stock. There is a primary difference between a Trend Following system – which we employ – versus a Tax Efficient strategy. We’d take a profit should the stock decline below important benchmarks. Declines below certain sell points raise the question of whether the stock is even in an uptrend. By the way, how hard it is to find a stock that can smoothly rise throughout the entire year? This means the company must produce 4 good earnings reports in a row and not sustain large pullback. 2017 was an easy year for Trend Followers. Even then almost 95% of the stocks we bought could not sustain 12 months of positive performance.
Are the drawdowns tolerable?
In point 1 I discuss a scenario of a single stock. But if Tax Efficiency is the goal along with long term Growth, you can now envision how volatile that portfolio would become. By not exerting proper risk controls, the portfolio would likely have longer and more significant drawdowns. Is that something you really want? Most investors, especially those who are new to investing cannot endure declines of 30% or more to their portfolios. This begs to ask: “Would you pay a bit more in taxes for less volatility?” In my experience which is based on client retention, the answer is “yes”. People hate losing money more than paying higher taxes.
What about lagging holdings?
Digging down deeper into portfolio management is the issue of what to do with lagging holdings. A lagging holding is the stock that you have had a gain on, but is now going nowhere. Our view is to sell laggards in a rising market. We don’t see the value of holding an investment unless its producing for you. A major advantage to this is to look for new potential winners. But the Tax Efficient portfolio may hang on to the stock till it clears the one-year hurdle. This is another factor contributing to underperforming portfolios.
To sum it up: Tax Efficient Investing can be a proper strategy for some investors but for most it isn’t. Investment methods must not just make financial sense. The methods must also be cognizant of the investor’s risk profile and emotional impact. One size does not fit all and every investment method has some inherent weaknesses. Most investors would probably feel more comfortable knowing the achilles heel of any strategy.
Cheers,
Brad Pappas
Volatility ETN’s like VXX appear to at least be putting in a short term bottom. Eventually Volatility will increase and the VXX could rise substantially. Long VXX.