The Post Parabolic Blues
4/8/2018
Since the 10% decline in the S&P 500 index in late January I’ve been using my Bull Market playbook to deal with a decline. Technically speaking we are still in a Bull Market but our Bull status is looking more precarious by the day. The Bull Market playbook means I’m looking for a double bottom or retest of the market lows off the initial sell-off. Secondly, I’d be looking to buy stocks on signs of a successful retest and rally.
Friday’s 2.19% decline was especially disheartening since it wiped out three days of gains. Stocks had been showing signs of recovery by trying to build a base from which to rally. Previously, markets were appeased by the story that the White House was using the tariff threats as a negotiating tool. But Friday’s news showed that markets are not buying that story any more. This is a dangerous and unpredictable situation that leaves any investor unhedged in stocks vulnerable to policy mistakes and reckless statements from the White House or cabinet.
The second leg down rallies have been relatively weak with reduced volume while declines have been larger in magnitude and increased volume (not good). This reveals that large institutional investors are in a liquidation mode and are using rallies to sell rather than using declines to accumulate. This is Bear Market behavior and is giving me pause to reassess the likelihood of another another significant leg down for stocks and the possibility of a Bear Market.
Perhaps this weakness is the aftermath of the parabolic rise in stocks earlier this year? Plus the extreme readings of investor sentiment? It’s possible, but I’d argue that stocks and bonds are now reacting accordingly to an aggressive Federal Reserve and a much higher than average possibility of policy mistakes from the White House.
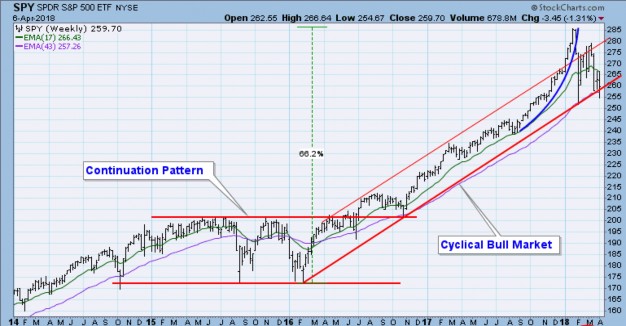
Chart 1
Chart 1 above, courtesy of Carl Swenlin of Decisionpoint, shows the importance of the $257 level for the “SPY” aka S&P 500 ETF. Both the 200 day moving average and the underlying trend line from the 2016 rally converge at nearly the same level.
There are also other important issues the world stock markets are contending with:
The global economic recovery is mature and slowing. Worldwide GDP data is showing clear signs of slowing.
Policy Errors: The tax cuts are the personification of fiscal irresponsibility and there’s no going back.
Trade Wars are “good and easy to win”. Investors aren’t fooled in the least by this rhetoric (see Smoot-Hawley Tariff Act). We’ve never had a President who can just as easily talk up a stock market and talk it down with rhetoric within weeks. This is certainly a market headwind for stocks.
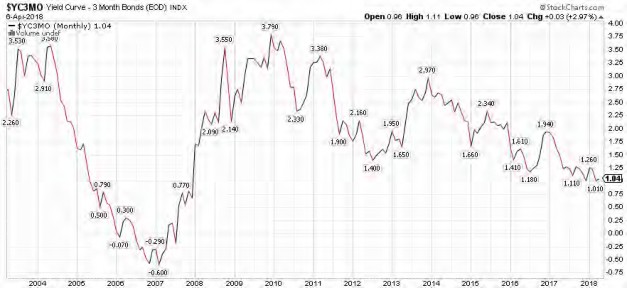
Chart 2
Aggressive Federal Reserve: The “Yield Curve” (shown above in Chart 2) is growing increasingly negative as short term interest rates are rising which will eventually kill the economic expansion. This causes investors to buy long term Treasury bonds. The higher short term yields and lower long term yield flatten the difference between short and long term rates which reduces the incentive for banks to lend.
The Yield Curve is a simple indicator and one of the most powerful tools to predict markets and the economy. Once the curve drops to .5 its “Goodnight Irene” for stocks and “Good Day Sunshine” for Treasury bonds. This is why we’ve recently added long term Treasury bonds to client portfolios.
If you’d like to learn more about the Yield Curve, there is an array of data from none other than the Federal Reserve:
https://www.clevelandfed.org/our-research/indicators-and-data/yield-curve- and-gdp-growth.aspx
Our Present Status: A sharp break in the price in Chart 1 below $257 without a rebound implies there is more selling ahead, which could be significant. Since my style of investing is based on reacting rather than predicting, I’d look for a $257 break to increase our existing hedges and further reduce stock holdings.
Should the price break below $257 not occur or occur briefly, I’d keep the status quo but expect the bottoming process to take longer than expected. I’d likely prefer to reduce stock holdings in strength until we see a positive change in market behavior.
Treasury bonds: My W.A.G. for Treasury Bonds and the economy is that the Yield Curve inverts in 2019 which will cause a full blown bear market in stocks and bull market in Treasury bonds. T-bonds could rally by more than 20% due to the reduced effect of lowering interest rates in an already low rate environment by the Fed. This could be followed by recession and bear market low by 2020.
Bottom Line: I’m agnostic to market direction as we can generate profits in accounts regardless of market trends. It’s the transition periods which we are possibly in that are tricky to assess. Once a new trend emerges, be it up or down, I’ll adapt and do my best to continue generating profits on your behalf.
Thank you,
Brad Pappas
The bullish data released within the past few days solidifies the probability that the Fed will not have to go another round of quantitative easing (others may call it quantitative wheezing) but the data confirms that the economy may be bottoming here in the third quarter with a slight acceleration into the new year.
This is great news for stocks as our holdings are finding a great deal of traction since the data release but what about bonds?
Bob Farrell was the long time head of technical analysis for Merrill Lynch many years ago and he had a list of rules, of which the first three must be kept in mind regarding bonds, especially Treasury Bonds:
1. Markets tend to return to the mean over time.
2. Excesses in one direction will lead to an opposite excess in the other direction.
3. There are no new eras – excesses are never permanent.

This is a chart of the 20-30 year Treasury ETF “TLT”. Its been in a primary bullish mode since the early 1980’s when Voelker broke the inflation spiral. But in recent years the gains have accelerated and now the current yield is under 3% which means its primarily a capital gains trading vehicle now. But just consider if the TLT were to eventually trade merely to the lows of last year? That would mean a loss of at least 25%! Can it happen? Absolutely. But your guess is as good as mine in terms of the timing but my guess is that it will be fast when the selling starts as investors will desperately want to lock onto their gains.
The selling of Treasuries will likely lead to the purchase of stocks and what I’ve referred to as the “Great Reallocation”. Just keep in mind that its likely that good economic news will be the catalyst.
Long TLT
Brad
Despite a terrific first quarter, 2011 morphed into a miserable year as the combination of US political bickering and misplaced worry over the prospects of a European debt contagion caused both professional and individual investors to flee to ultra safe alternatives. What made 2011 especially maddening was that investors who did stick with equities chose to hold their assets in the Dow 30 stocks which became almost bond surrogates at the expense of small and mid cap equities. This bifurcated situation created one of the largest spreads ever in performance between the Dow Jones Industrial Index of 30 stocks (+1%) and the Russell 3000 (-7%).
Consistently ignored in second half of 2011 was improving domestic economic data: Improvements in Housing, Consumer Confidence, Auto Sales and Jobs was ignored by the deafening, attention grabbing headlines from Europe. Corporate earnings which are the primary driver of stock prices continued to grow at an approximate 10% pace and look to repeat this performance in 2012.
Despite the improving data, the consensus of opinion amongst investors is gloomy and that is where I believe the opportunity for 2012 is. Professional and individual investors have abandoned equities with a ferocity unseen since 2008 and are settling for yields in Treasuries in the 2% range. Simply put, at a yield of 2% it will take 36 years for the principal to double in value.
Investors having sold heavily in the second half of 2011 have likely discounted the bad news from Europe and the unfounded fears of a US recession. I seriously doubt renewed fears of European recession or budget issue can muster a second similar selloff. Domestic and European issues are well known and have a likely probability of diminishing in consequence.
It’s a frequently commented upon topic that the consensus view of economics and investing will usually be the strategy that bites you the hardest since it’s rare that the consensus view actually comes to fruition. Investing would be quite easy if that was the case, since you could simply find what the prevailing opinion was and invest accordingly.
For 2012 I offer what I believe will be five minority/contrarian views that have a better than average chance of being accurate in 2012.
1. The stock market has a very good year and our models and client portfolios have a very good year. The long term top of 1500 on the S&P 500 is a very good possibility by 2013 as
investors realize the fear driven mistakes of 2011 and move assets from bonds back to equities. A Romney victory would likely be a significant market positive (I am a Democrat) and could propel stocks to 1500 sooner than expected. Newt, on the other hand would likely be a major market headwind while the re-election of President Obama (the likeliest possibility) would be a moderate positive for stocks.
Investors who shunned small and mid-cap sized equities in favor of Index mutual funds and bonds had either minute gains or losses while the vast majority of Value portfolios had a terrible 10 months. The biggest groups of investors: Institutional, Hedge Funds and especially Individual investors are very poorly positioned with very high allocations to cash, gold and bonds.
It’s my belief that 2012 will be a year of mean reversion, where the investments that performed poorly in 2011 will produce outsized gains while bonds post negative returns and Indexes lag managed portfolios by a wide degree.
The 50 year average yield on the 10-year Treasury note is 6.6% and now its 2% while the 50 year average multiple on stocks is 15 times earnings, now it is at 12.
As mentioned in my blog previously: The US market risk premium (earnings yield minus the risk free rate of return) is at a 37 year high. This is another statistical metric highlighting the unusual value and upside potential in equities at present.
2. Treasury bonds will post negative returns in 2012.
I expect 10 year Treasury bond yields to rise in excess of 3.25% resulting from an expanding economy and less worldwide fear. The decline in bond values should provide the impetus for an asset allocation shift away from bonds and into stocks.
3. There will be no recession in the US and we will have at least one quarter where our GDP growth is in excess of 3%. Earnings growth in 2012 remains at a moderate 10% growth rate and the US Federal Reserve leaves interest rates unchanged which is very friendly to a rising stock market.
4. President Obama is re-elected. In my opinion the President’s electability will have much to do with the comparative un-electability of the Republican opposition. Be it Romney, Gingrich, Paul or Santorum, they all have major comparative flaws and would be hard pressed to gain the important Moderate electorate. If I’m wrong and Romney is elected, there is the possibility of reaching 1500 on the S&P 500 earlier than expected as his election would be viewed as a market positive.
5. The European Union will not crash. Problem solving in Democracies is almost always a messy proposition. Seamless and definitive political decisions are the hallmark of Authoritarian rule. Only until a crisis is upon the decision makers do they generally drop their political biases and come to an agreement. I don’t think that there will even be a defining moment when the Euro crisis has been solved; it will be from a series of decisions and actions rather than an all encompassing point in time.
Deep discounted financing (loans provided by central banks at very low interest rates) worked in 2008 to avert our banking crisis and they will likely work again for Europe. The import issue is that their banks simply get financing, the rate is of secondary importance.
Investment Status: Equity markets at present are in excellent shape with all major US indices breaking out to new rally highs. I believe it’s quite possible that that the rally will continue for several more months at least and that 1500 on the S&P 500 are attainable. As you can see in the chart below the SPX has been making a series of higher lows since September but our portfolios really began to out-perform in early December.
Another positive factor for equities over the next several months is that volatility continues to subside. This is necessary for investors to feel secure to deploy funds into equities and is frequently common in the early stages of new market rallies.
One of the biggest factors that I see driving markets higher in 2012 is that the alternative investments, particularly money market funds, CD’s and US Treasury Bills all pay under 1%. Should markets continue to move higher there will be a tremendous amount of cash coming out of those investments to seeking a higher rate of return. Investors may actually panic at the thought of being left out while their present fixed income returns so little.
All in all I expect that 2012 will result is a good year for our clients. Investor expectations are virtually nil and the masses have parked a huge amount of capital in ultra low yielding money markets and short term bonds. 1% returns are not going to help anyone in their retirement or capital growth plans. If equity markets continue to show strength and reduced volatility I do expect a very large asset allocation swap out of low-risk investments and into equities. Regarding equities, I am especially in favor of equities that had a rough year in 2011 due to their expected better than average risk / reward rather than the much beloved darlings like Apple and Google.
RMHI Model: There was no surprise that our investment model took a beating last year. Since my own retirement accounts are invested in the model as well, I can certainly identify with investor pain.

The chart above is the hypothetical back-test of the RMHI model (without hedging) dating back to 2001 till the first week of 2012. Actual client portfolios have tracked very closely to the chart below and while 2011’s decline was severe the performance began to curl higher in December. The chart is divided into thirds and the blue line is the S&P 500, which appears as a simple flat line over 10 years due to its lack of net progress.
The best way to gauge the model will be to track its progress during our current rally and all appears positive at this present time. As of today (1/23/2012) equity portfolios year to date are up an average of 7.5% net of fees and expenses versus 3% for the S&P 500.
All in all, I expect a good to very good year.
Brad Pappas
This letter does not constitute an offer to provide investment advisory services or attempt to effect securities transactions in any state or jurisdiction where such an offer or the provision of such services would be prohibited. Such an offer can only be made in states where we are registered or where an exemption from registration exists. The purpose of this letter is solely for the dissemination of general information on products or services. Investment advice or the rendering of investment advice for compensation will not be made absent of compliance with the state investment advisor requirements. For information concerning the licensure status or disciplinary history of an investment advisor a consumer should contact their state securities law administration. The information contained on this website should not be construed as financial or investment advice on any subject matter. Rocky Mountain Humane investing expressly disclaims all liability in respect to actions taken based on any or all of the information on this letter. Rocky Mountain Humane Investing, Corp. does not warrant the accuracy of the materials provided herein, either expressly or impliedly, for any particular purpose and expressly disclaims any warranties of merchantability or fitness for a particular purpose. Rocky Mountain Humane Investing, Corp. will not be responsible for any loss or damage that could result from interception by third parties of any information made available to you via this site. Although the information provided to you on this site is obtained or compiled from sources we believe to be reliable, Rocky Mountain Humane Investing, Corp. cannot and does not guarantee the accuracy, validity, timeliness or completeness of any information or data made available to you for any particular purpose.
A short while back I decided to return to writing on the blog as a way to encapsulate my thoughts and review tactics and strategies. With the noise that exists within our culture and data driven industry we can lose ourselves to the impulses caused by the most recent data points.
The talking heads on TV uniformly speak with such clarity and conviction but are never held accountable to the results of their recommendations. Do they eat their own cooking the way I do? I doubt it very much. So while you the reader may consider that this blog is for your benefit please consider its also for my benefit at well.
What do we know:
The political leadership existent within the US and Globally lacks the political will and savvy to solve the debt and currency crisis. There is a continual sense that their intentions are to “kick the can down the road” for future leaders and tax payers. The lack of cross the aisle cooperation between parties is pathetic. The Republican’s lack of cooperation, even at the cost of benefit to the country in order to gain the White House appears to be the game plan. Speaker Boehner is even disagreeing with the proposed short term tax credits proposed in the jobs bill.
If you’re a country that cannot print money then you are crashing. Why this is lost upon the tea party, I have no idea.
There is a global race to devalue currencies. PIMCO predicts the Euro will fall to 1.20 USD within three to six months. When Janene and I were in Paris this May the Euro was 1.45 USD.
2012 estimated earnings for the SP 500 are coming down in deliberate fashion. In August the estimate for 2012 was $112, now they are at $110 and falling.
Most European stock markets are down 15%-20% while the US is down 2% for the year. Macroeconomic data continues to deteriorate. Last night Goldman Sachs lowered their end of the year target for the SP500 to 1250 down from 1400.
Investors are extremely bearish. AAII figures show 40% bears against 30% bulls. This is an uncomfortable status in light of my hedged positions. The issues of Greece, the Euro, our budget impasse, US debt, falling currencies and high odds of recession appear to be largely baked in the cake of many share prices.
Shares of dividend paying stocks look very attractive relative to bonds.
Contrary to Bernanke’s talk: US money supply is rising. Rising money supply frequently has a steroid effect in the short term for stock prices to move higher.
With Peyton Manning on the sidelines is there is no doubt that Tom Brady is simply the best at his position.
What I don’t know:
How low will SP 500 earnings estimates fall before they bottom? The average recession cuts earnings by 25% from the previous peak or in our case $75 a share.
While a Greek default is inevitable, can Europe handle a Greek default in an orderly fashion, and then an Italy default, followed by a Portugal default……..rinse and repeat.
Will the Chinese support the Euro to allow multiple currency options for its growth.
Can the European banks reduce their systemic risks and raise gigantic amounts of capital they require?
One potential cure-all would be for the Chinese to let the Yuan trade freely on its own merits? Is this just pie in the sky hopin and wishin?
Will investors finally purge Treasuries en masse and allow yields to rise?
Is our unemployment issue systemic (see Doug Kass) or cyclical (Paul Krugman)?
Can the opinions expressed by Tim Geithner in stating there will be no Euro Lehman’s be trusted?
How can Duane Allman and BB King be ranked higher than Eric Clapton in the Rolling Stone Top 100 guitarists of all time. I’ve adored Live at the Fillmore East since I was a kid and Riding with the King is superb but shouldn’t the breadth of work by Clapton be considered?
Long Clapton
Very seldom do we see six straight weeks of market weakness, especially without a notable bounce in the indices. This has caused many to question the validity of the bull market and ponder the possibility of the commencement of a full blown bear market.
In my view, odds remain high – despite the pain – that we remain in a bull market and we’re experiencing a normal garden variety pullback. We remain just 6% off the high for the S&P 500 while the Russell 2000 has retreated approximately 8% while that may not sound like much its enough to place our short, intermediate and long term sentiment indicators have moved into positive territory for the first time since late last Summer. Corporate earnings growth remains very strong and unlike what we’d expect to see if entering a recession. While the risk exists that weaker than expected economic reports could result in disappointing earnings preannoucements, any rush to presume this risk could be premature.
While the economy may be going through the proverbial soft patch with intermediate term Treasuries moving below 3% yield the primary causes appear to be resulting from the flood in the Midwest, rise in the dollar, Greece/Euro, earthquake in Japan and the serious move higher in oil prices. While the floods and earthquake are temporary in nature, the rise in oil is potentially reaching the point of demand destruction. However, I do believe that these issues are now absorbed into the prices of most equities and bonds.
Risks remain though and to the shock of many, the US has been a much better place to invest your money than the beloved Emerging Markets. Inverted yield curves are showing up in many countries: Greece, Ireland, Portugal, India and Brazil. Historically speaking, inversions almost always lead to recessions.
During this period of weakness we’ve sold several holdings that had fallen in our ranking system and have begun to add new names as I believe that the odds are growing that 1250 on the S&P will hold.
Deletions:
PKOH
NTL
CPWM
XIDE
GKK
Additions:
COOL
CMT
GKK (buying back in at lower price)
IEP
ITWG
HIT
As always be careful out there.
Brad Pappas
Long all mentioned.