RMHI Client Letter, Sept 6 2022
September 6, 2022
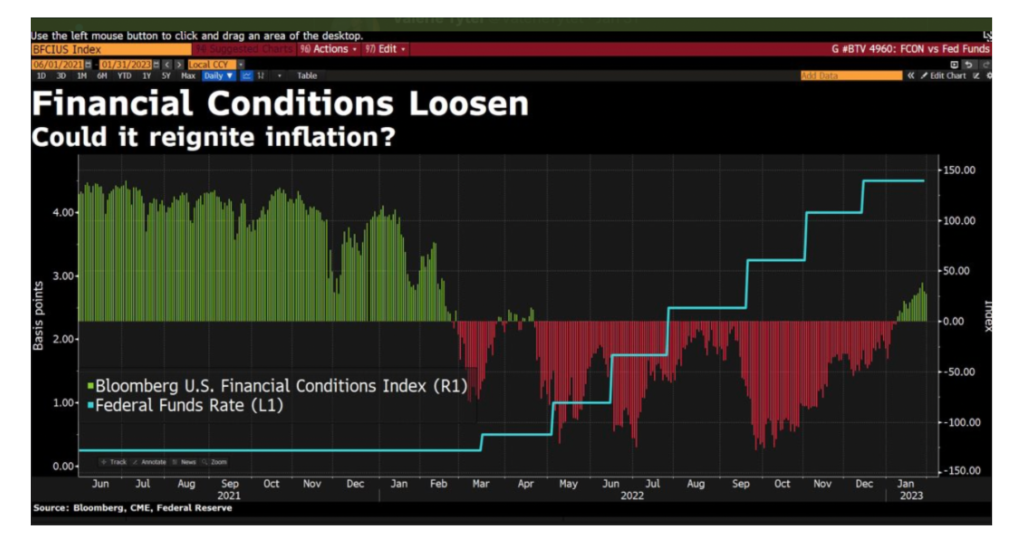
Both stocks and bonds have declined since my last note to you from August 26. The Fed must correct the excesses created by the Fed during the Covid crisis. The official US response was $9.5 trillion of stimulus ($5tn fiscal and 4.5tn monetary stimulus). This amounted to 38% of GDP.
To put some perspective on how excessive the Fed was: During the financial crisis of 2008 the total fiscal stimulus was 5.7% of GDP (source St. Louis Fed) and monetary stimulus was 9% of GDP (Source Fed balance sheet). Added together there was a total of 14.7% of fiscal and monetary stimulus relative to GDP. And according to Brian Belkin there was no exit plan.
So, total Covid stimulus was 2.6 times larger than the 2008 credit crisis. I’m not even going to add stimulus data from the European ECB and other entities.
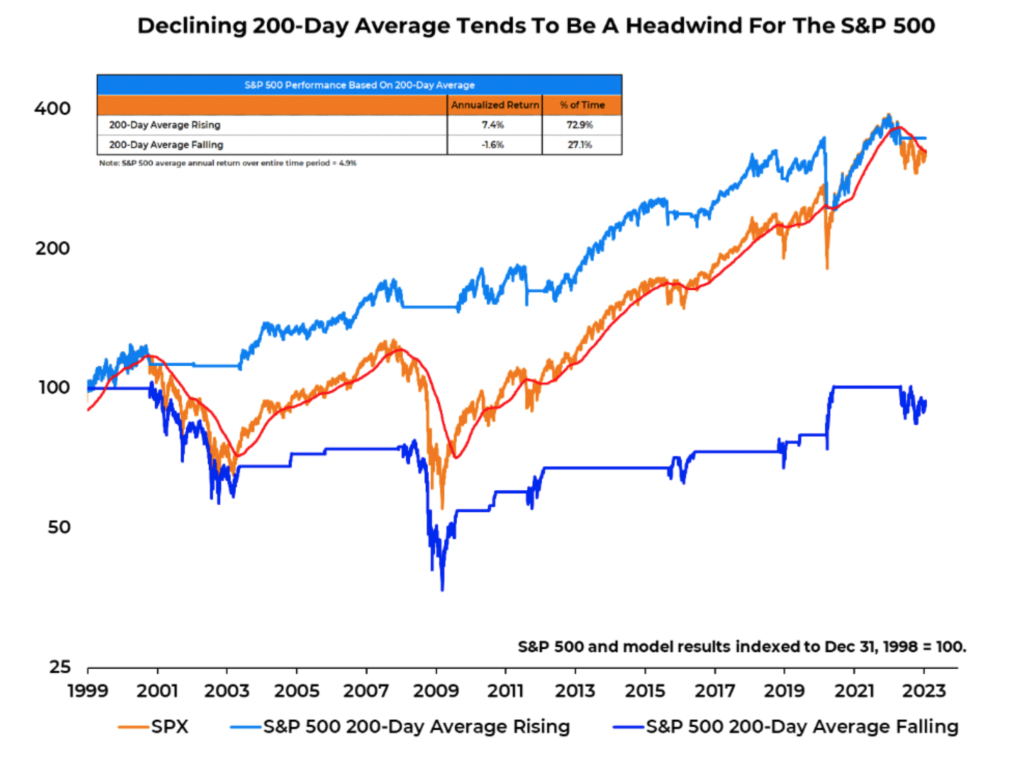
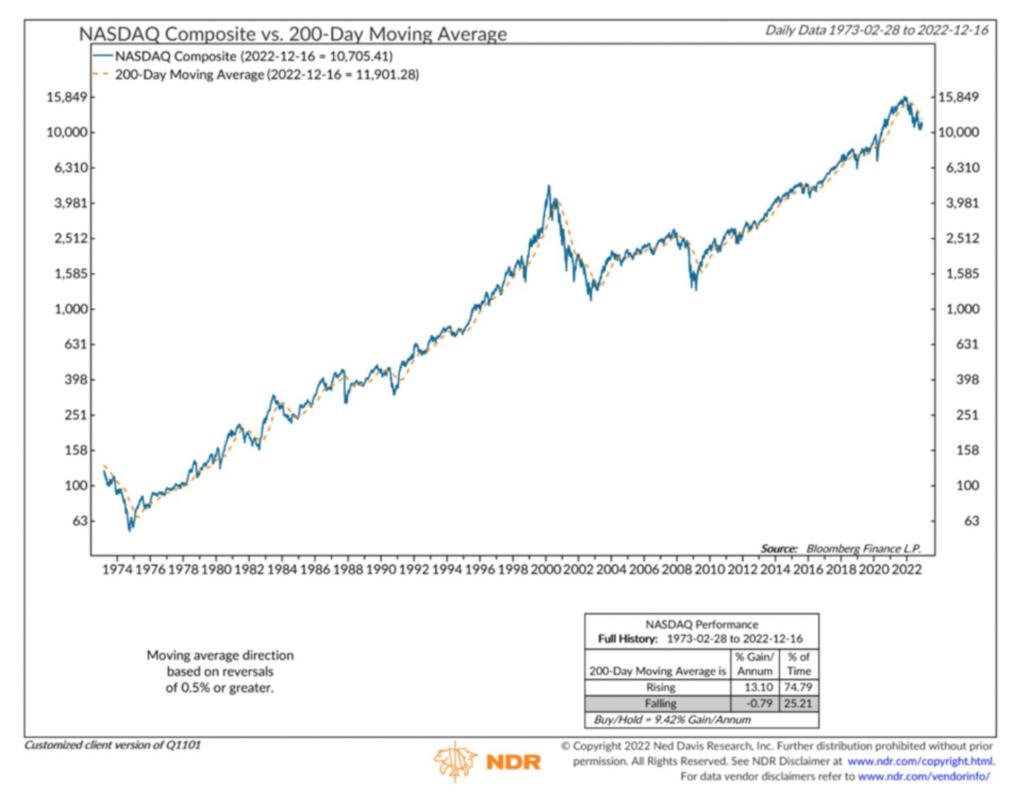
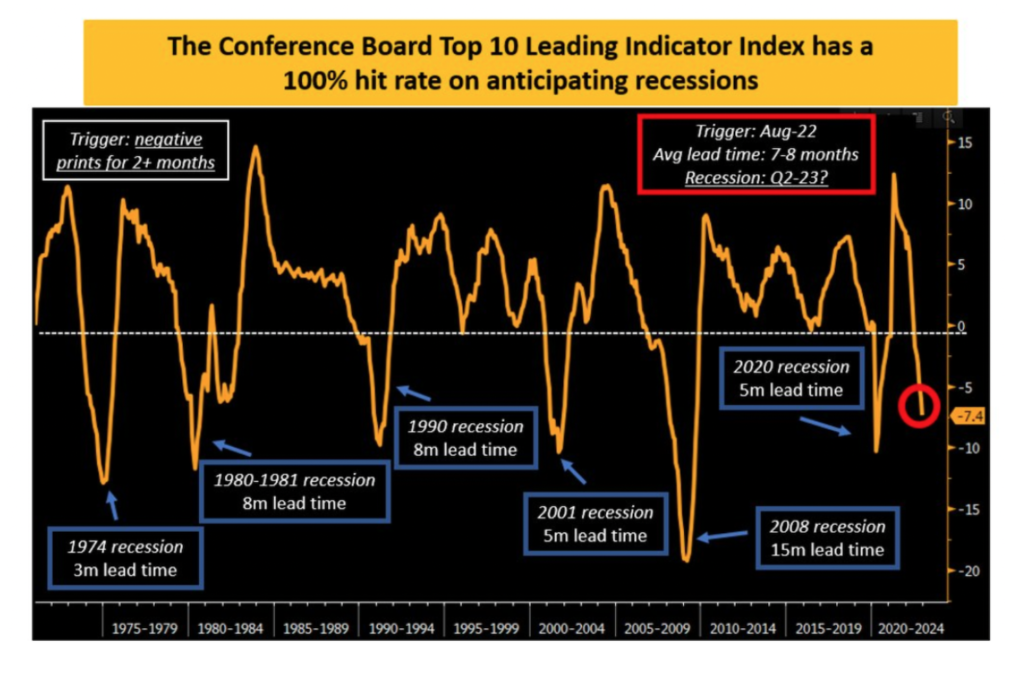
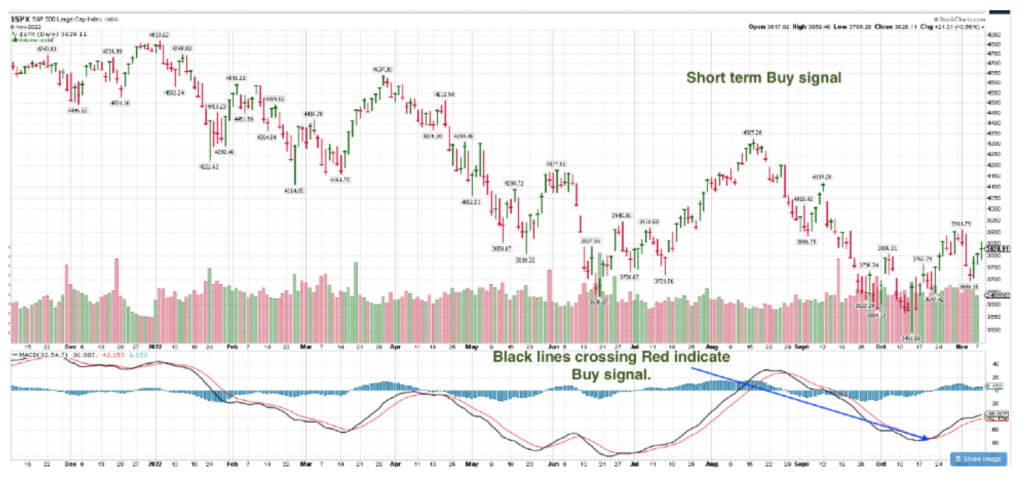
As the chart above shows given the excesses of past years its possible there is much more downside risk than investors are expecting. The 200-month moving average which is at 2250 could be reached. Thats another 40% down since at present the S&P 500 is at 3900.
Plus, Treasury bonds which have been very unforgiving have already pulled back and gone below their 200 month moving average.
So thats where we are, doing nothing and remaining patient. I still believe there is a moving coming in Treasury bonds but I have no idea where or when it will begin. My guess is that for bonds to move higher it will take another gruesome decline in stocks.
Thank you for reading
Brad Pappas
RMHI Client Letter, Aug 2022
Driving Forward Thru The Rear Window
August 2022
The recent stock market rally over the last month garnered most of the attention from investors. The idea that just because the Treasury bond market has stabilized its now time to buy Growth Stocks is foolish. Buying due to lower rates works when the Fed has your back but its lethal when they’re not. This is typical of investors who don’t know any better and desperately need Fed stimulus to push stocks higher. The problem is the Fed is now doing the opposite with restrictive policies that are toxic to stocks but ideal for Treasury bonds (T-Bonds).
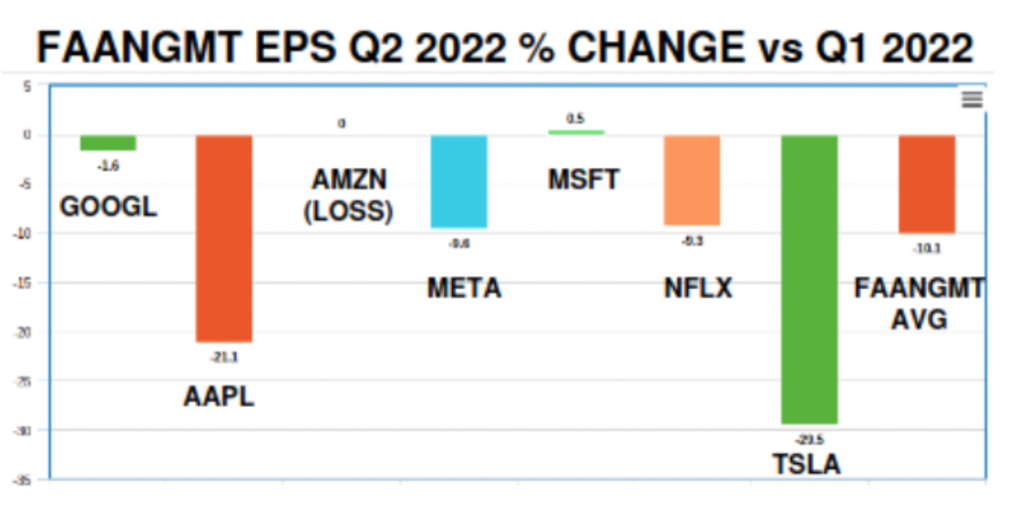
Earnings for these Growth stock giants are down 10.1% sequentially. Earnings are declining and thats what we would expect in a recession.
Nvidia could be added to the list. The semiconductor giant reporting Q2 revenue $6.7B versus estimate of $8.12B.
The Federal Reserve is fully focused lagging indicators like the Consumer Price Index and employment. The CPI is a reflection of past data and it takes 6-9 months for the rate hikes to have their effect on the economy. So the Fed can easily overshoot their objective of reducing the CPI. This also means they’ll place the country into recession (assuming we’re not in recession).
Since the data of the US going into recession is increasing prices for long term maturity Treasury bonds are rising. Even though the Fed will be raising short term rates, longer term rates are controlled by the open market. Yields are falling because present policies will cause a recession which will force the Fed to lower interest rates in 2023.
T-bond markets are forward thinking while the Fed is monitoring rear view data.
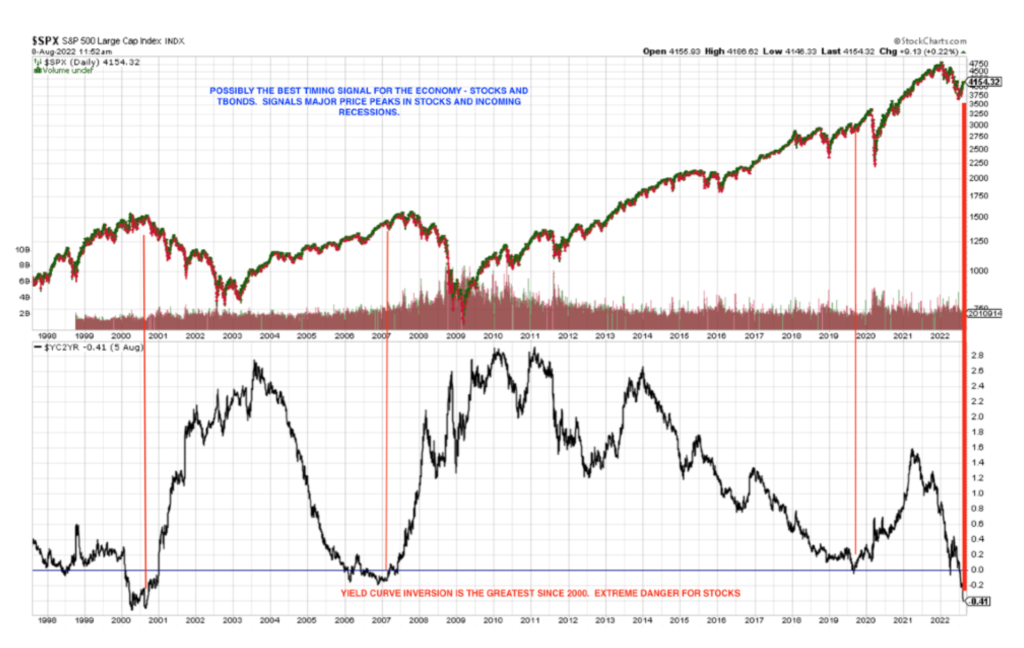
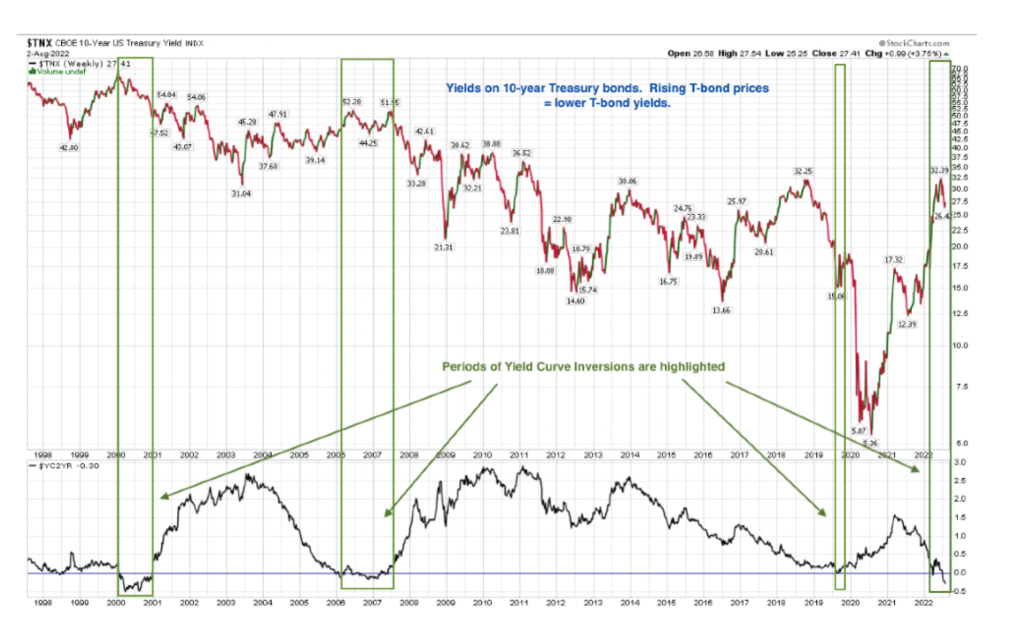
This is the most important chart I can show you. When the yield on the 10-year Treasury bond moves below the 2-year Treasury bond its called “Yield Curve Inversion” or YCI. YCI has a great history of being a forward indictor of rising unemployment, recessions and falling stock prices. The YCI has correctly anticipated every recession for the past 50 years.
When the Yield Curve inverts it’s a signal that interest rates will stop rising and T- bond prices will rise. This is why our highest asset allocation is to Treasury Bonds.
Recently RMHI became a client of Michael Belkin of the Belkin Report. Belkin created his proprietary forecasting model at UC Berkeley and further refined it as an analyst at Salomon Brothers. His institutional clients manage just under $2 trillion. From my perspective he is one of the best.
Based on his modeling:
- Treasury bonds have exited their bear market which stocks have only just entered.
- Recession “Our model forecast continues to point straight down for real GDP growth and corporate earnings, which are ultimately the determinants of stock prices. The forecast suggests the recession is just starting and will continue for 12-18 months. Sell stocks, buy government bonds.”
- The current bear market in stocks is only about 1/3 finished. Nasdaq could fall 60% from the November 21 peak. The S&P 500 could fall 50%.
- How best to position oneself for the near term future? Exactly what we are presently doing. A. Own Treasury bonds. Belkin expects the “TLT” Shares 20-30 year Treasury bond ETF to rise 15% to 20%.
- When stock markets make temporary bounces higher add our 1x shorts (that benefit from falling stock prices) “SH” “RWM” and “PSQ”.
- “Market psychology currently equates lower government bond yields with stock market optimism, especially for tech stocks….We disagree. Thats now how it works in a recession. Go back and look at 2000-2002 or late 2007 to early 2009. Tech stocks and the market got creamed while T-bonds rallied because the economy and S&P earnings collapsed. That is probably wha we’re setting up for again. Sell stocks and shift into government bonds.”
Belkin notes that there will be a shift in investor psychology away from stocks to T-bonds based on fear of a falling stock market. (This always happens in major bear markets. Investors give up hope in stocks and gravitate to the safety of T- bonds. As a result when the stock market eventually bottoms they’re too scared to return to stock and wait till the rally has already moved a great deal.)
As Stanley Druckenmiller has said: “Never, ever invest in the present……You have to visualize the situation 18 months from now, and whatever that is, that’s where the price will be, not where it is today.”
Thank you for reading
Brad Pappas
August 9, 2022
RMHI Client Letter, July 2, 2022
Todays Forecast is in the 70’s… the 1970’s
July 2, 2022
The standard recession investment playbook is to hide in Treasury bonds while stocks and the economy sink into recession. That has not worked as we’ve been stopped out twice on Treasury bonds this year. The most recent sale of bonds in client accounts occurred when I learned that the June CPI (Inflation) data was going to come in HOT, 8.3% to be exact. From what I’m hearing the July number could be in the range of 8.5% but that could be subject to change.
Inflation could be slowing due to Demand Destruction. As in, the cure for high prices is high prices. High prices alone will cause disinflation (not Deflation) and the consumer decides to hunker down and cut spending.
The chart below is from the Atlanta Federal Reserve and it reveals what I’ve been saying for quite a while…..Recession is in our midst. Ignore Fed chair Powell and any other politician who avoids telling the truth. Biden’s polling number are bad enough so he’s going to try to put a positive spin on the economy. Just imagine if he told the truth and said to be prepared for imminent recession? Powell on the other hand is an unelected official and he’s spinning the truth as well.
The Atlanta GDP Now data has gone below zero. This makes me think of The Who’s first hit single “I can’t explain”. I can’t explain how or why officials want to spin the truth. Then again, thats like screaming “fire” in a move theatre.
But here is the predicament the Fed faces: The Fed is raising interest rates into a weakening economy. Thats not the way it’s supposed to work. It’s like pushing over the Tower of Pisa.
The dilemma of the Fed remains a choice of two bad outcomes: If they continue to raise rates – the economy could go into a prolonged recession. If they fall short of raising rates enough high inflation will persist. Powell is on record that inflation is the higher priority.
The number of Fed hikes is not a static number. It’s been hovering between 7 or 8 hikes for months depending on the inflation data.
The current rate of inflation is not Biden’s fault any more that high gas prices. It’s a result of almost constant increase in money supply and stimulus since 2009.
As mentioned earlier, twice this year I’ve attempted to buy Treasuries but my timing was wrong. But now that Recession appears obvious. Many of the recession deniers
will look like idiots in a year but thats nothing new. On the bright side we may have seen a peak in interest rates. This implies that bond prices may be stabilizing.
It’s not just the incoming recession data that could cause stabilization of bond prices. The CPI might be peaking now as well.
The chart below shows the yields on an array of bond maturities. It appears that it’s possible, maybe, with some luck, there’s a chance, cross your fingers, hopefully, that the bear market in bonds may be ending. Focus on June in the chart, yields may be rolling over and prices could stabilize or rally.
Investment markets are always forward looking, typically 6-9 months in advance. It doesn’t matter if its stocks or bonds. The markets are potentially reflecting early 2023 now. This is why the stock market will likely bottom out in the middle of the recession.
China: The Chinese economy has been in a prolonged contraction for well over a year. And, as is typical their stock market has been decline for almost a year and a half. So, prices have fallen quite a bit. But now China is the only major industrial economy that is currently expanding its money supply to stimulate the economy.
Since the Chinese central bank has begun to inject capital and lower interest rates the Chinese stock market is emerging from Bear Market to early stage Bull Market. Sources of growth right now in the world are rare and China stands out.
To say that China is controversial might be an understatement. But I’ve never screened for countries only for industries or businesses that do not meet the RMHI screens. So if you don’t wish to own anything from China just let me know.
To be more accurate: Both Europe and the US are Shrinking their money supply.
Tuttle Capital Short Innovation ETF aka SARK
We have had almost a perfect record trading in SARK with the most recent profit taken on Thursday. In my process I don’t like to buy anything all at once. I always assume the price of a purchase may decline after the initial buy. Of course, it doesn’t always work that way. The recent decline in SARK which I used to buy in was very short lived. I just took the profit as it was presented wishing we had more shares.
I’m thinking that we may be at the end of trading SARK for the time being. SARK is now showing a pattern of lower high prices and lower low prices – a negative development. SARK is sensitive to interest rates. Its best days were when rates were rising but if rates do decline Cathie Woods long national nightmare could be over. The opposite of SARK is ARKK aka Ark Innovation ETF and that may be forming a tradable bottom.
Cathie Wood’s ARK Innovation ETF may be forming a bottom. At minimum it’s no longer making new lows but may need time to “base”. A base is a prolonged period of sideways movement within a trading range.
Summary: Stocks remain in a Bear Market with the Nasdaq composite index down 28.5% year to date. The S&P 500 is down 21.1%. While I would really love to have our client account go into the green for the year we will likely need the Treasury bond market to behave in order to do so. Since our YTD loss is minor, it’s possible with the CPI peaking that bonds may have made a bottom in price and a peak in yield. But more time will be needed to confirm this thesis.
Stocks remain by and large untouchable except for short term periods. Every prolonged bear markets in the US has had rallies that lasted for weeks into months before the market rollover over once again. But this hasn’t happened yet. I am on the lookout for this since stocks that were crushed this year are showing some signs of stabilization: See ARKK.
China has likely ended their prolonged bear market due to Central bank stimulus. Despite this, China is not a place to make big allocations of assets.
While I believe there is hope for progress in the intermediate time frame the overall economic background remains negative. We may be at or near the point when bad economic news becomes good for Treasury bonds. Time will tell.
Thank you,
Brad Pappas
RMHI Client Letter, May 17. 2022
RMHI Client Letter
May 17, 2022
Years ago when I took my first college course in Economics I quickly understood that all things economic are correlated much like Dominoes. The first domino was Fed Chair Powell talking about aggressive rate hikes. The second domino was the May .50% rate hike, which was the largest hike in Fed Funds in 20 years. This domino tips over the slowing growth domino which tips over high stock and bond valuations and eventually hundreds of dominoes including housing, employment, wages, defaults, etc tip over in sequence.
The Fed had been telegraphing for many months that they were to embark on a series of rate hikes. Their goal was to increase the short term Federal funds rate from .25% to 3% in a year. That is an astronomical rate of change.
Any reasonably intelligent investor who understood what really moves risk assets and had an understanding of Fed policies could anticipate what would happen. The Feds job right now is to tighten financial conditions, slow down economic growth and that means lower prices for equities. In doing this the Fed will inevitably break stuff.
In my opinion this period now is the worst set up for investing since the 1970s. In the 70’s we experienced higher interest rates and inflation and the scourge of disco. Stocks spent a decade in a trading range and finally broke out to the upside in August of 1982, when I was a gofer at Lehman Brothers Kuhn Loeb.
The decade of the 70’s was a prolonged trading range for stocks that showed no net progress for those who “Buy and Hold”. This is very unlike past decade which had the Fed as a massive tailwind to push stocks higher. The Fed tailwind is now over. The tools to succeed in a 70’s style investment backdrop are relatively simple trend following systems which I use.
Despite this backdrop Bank of America reports that individual investors have bought the dip in equities with the biggest inflows since December 2020. The ARK Innovation ETF (this periods poster child for reckless and suicidal investing) continues to see $1b plus inflows despite its free fall in value. Setting your money on fire has better entertainment value that watch the fund fall 4-10% a day. More later on below.
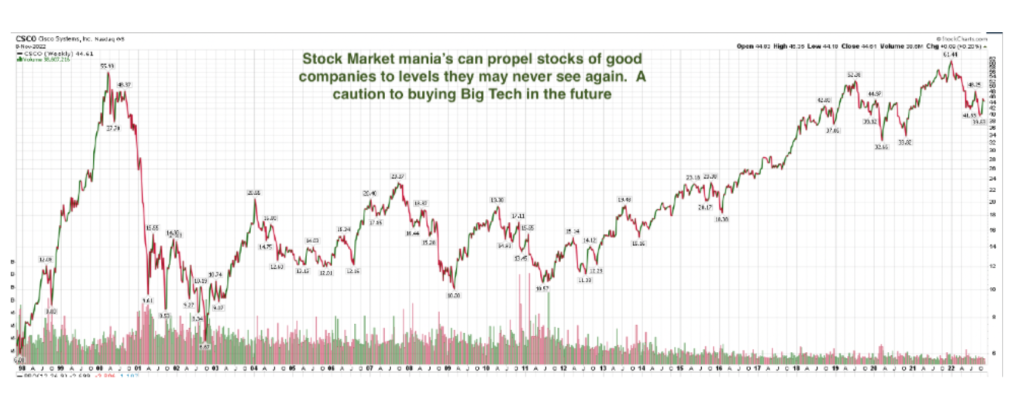
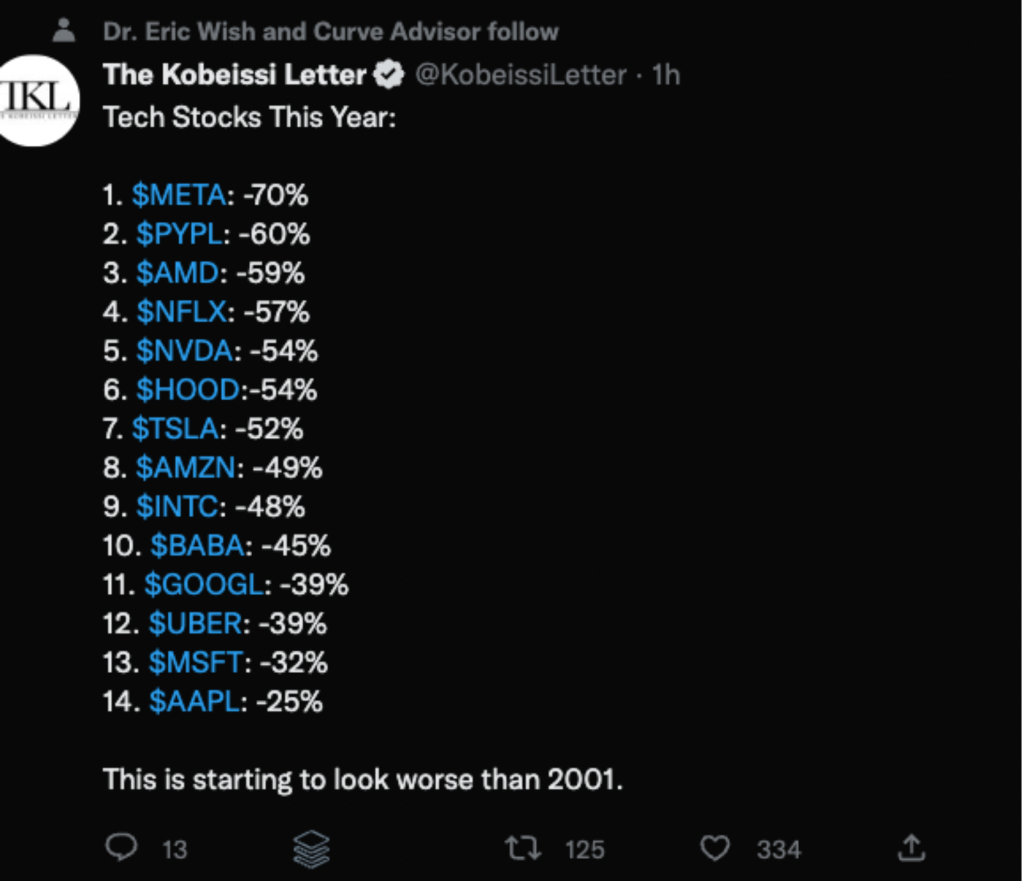
Last year I spoke many times of the lack of individual stock participation as the market indices moved higher. I was especially concerned when just a handful of stocks (Apple, Google, Microsoft, Netflix and Facebook) were propping up the market and not really an accurate measure of market health.
With that in mind and know what likely could happen I opted to pull back risk late last year. The market indices that showed glowing returns are in the process of being trashed. The Nasdaq 100 has now erased the entire 2021 return and is now working on eroding into the 2020 return. Many investors who owned individual equities have lost their 2020 gains as well.
How awful for an investor who had good profits in 2021 in a taxable account yet loses all the gains in the first Q of 2022? And, still has to pay the tax on 2021 capital gains Year To Date (in just 88 trading days): The Nasdaq Composite is down -25.4% (worst start of the year on record). The Russell 2000 is down -21% and the 30 year Treasury bond is down -20%. The overly beloved 60/40 stock bond allocation is down -15%.
The stocks that have seen the most damage so far have been the super growth companies with very high valuations and the meme stocks. But I have my eye on the mega-caps: Apple, Microsoft, Tesla, and Berkshire. If they rollover it increases the downside risk to the stock market since these are core holdings that you only want to sell if you’re forced to.
The selling has been very systematic with a majority of the selling coming from institutional investors and hedge funds. Many hedge funds are down more than -40% on the year. Based on the hedge fund bonus compensation standard – they won’t receive a bonus this year unless they can rebound 80% from the -40% loss. Since they’re way below their high water market with no realistic chance to earn a bonus, many are just doing mass scale liquidations on a daily basis with little concern for value or price.
In addition to the Hedge Funds we also have a generation of investors, retail or professional who worship at the cult of leverage and growth. This easily represents 95% of all investors. These are investors who are clueless or don’t care about Fed monetary policy and its domino effects. It’s much sexier to talk up growth rates, earnings, revenues or moving averages or what Jim Cramer has to say.
What is “SARK”?
It was common knowledge among those who understand monetary policy and macro economics that the ARK Innovation ETF was going to blow up. Tuttle Capital Management had the brilliant idea of mimicking the trades of the ARKK ETF by doing the exact opposite of the ARKK purchases. So they created the SARK ETF.
If ARKK held shares of Tesla with an 8% weight, SARK should short shares of Tesla with an 8% weight. Since ARKK trades are public Tuttle could see the trades within minutes ARKK is run by Cathie Woods and had developed a cult like following from her frequent appearance on CNBC and a very large media campaign. True story: I’m filling up at a gas station that had a TV screen on the front of the gas pump. And there I watched Cathie Woods talk about her collection of “innovative companies”.
In general she has been a hype-master for her ETF with claims of outrageous returns going forward. But in truth for her entire career she has only had one superior performance year, 2020. Her ETF benefitted from and extremely aggressive Fed that acted like a hurricane of a tailwind.
The issue with ARKK is that when the Fed raises interest rates to slow down the economy the shares of the fastest growth companies that have the highest valuations get hit the worst. Many of her holdings will fall 70% or more. And, the ARKK is loaded with just those types of stocks.
It’s the classic Wall St. story where massive hubris with a touch of sociopathy is devastating the people who invest with her.
ARKK shares in full crash mode.
(Should be renamed Titanic)
ARKK Profit and Loss for May 5th, 2022
Here is a chart of SARK which started trading in November. I did not discover it until late March and it has been a great success. We’ve round trip traded it 4 times and all at a profit. But it’s volatile so I don’t want to hang on to it other than for short periods of time. Our most recent cost basis was approximately $52 and I’ve been selling and buying back. The most recent sale was at $70.5.
ARKK is likely to make a violent leap higher very soon. So I’d be a buyer once again of SARK when it pulls back.
Green Brick Partners owns and develops single family homes in the Dallas and Atlanta areas. It has a fantastic balance sheet and 35% earnings growth this year. The stock came down hard when interest rates rose due to mortgage affordability, etc. But it’s now a beneficiary of short term rates turning lower.
Trinity Capital is a business development company that offers debt financing to corporate clients. The shares have a 8.9% yield which offers some downside risk protection. But for social investors it offers something else entirely.
Buying the stocks of companies like Oatly or Beyond Meat has proven disastrous to any kind of investor. Part of the reason is those two companies don’t have a moat to protect them from competition.
Trinity offers debt financing to some of the most progressive companies in the US. Trinity went public early in 2021 so its still largely unknown. For quite a long time I’ve been looking for investments that are both relatively safe, provide cash flow and are progressive.
Since debt service is a higher priority than equities if a company comes into financial trouble the debt holders get paid for first before shareholders. The upside for debt is not as infinite as it can be for stocks. So in return it offers more protection.
A few of the companies Trinity has financed.
Bowery Farming – Sustainable produce grown indoors vertically.
Daring Foods – 100% plant based chicken.
Dandelion Energy – Geothermal cooling and heating.
Impossible Foods – Plant based meat.
Miyokos Creamery – Plant based cheese and butter
Suniva – Solar cell mfg.
Super73 – Electric Motorcycles
Treasury Bonds and the Dollar
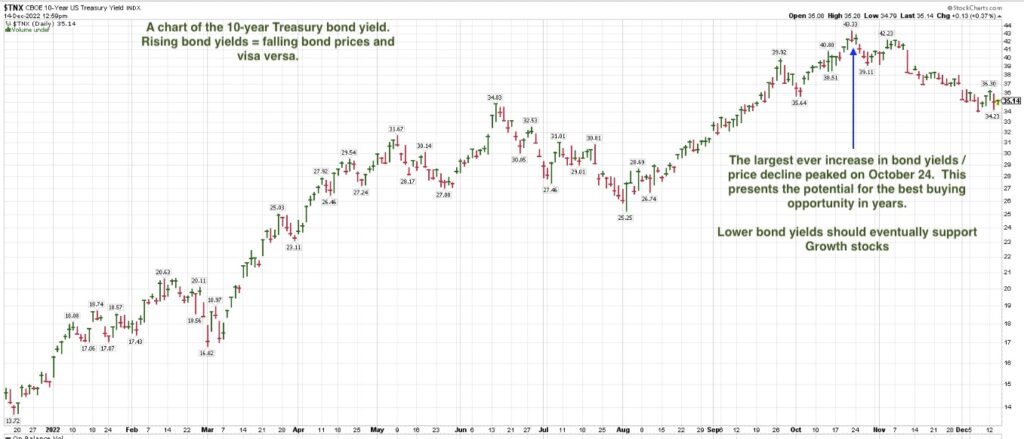
A month and a half ago I was too early with bond purchases and took a loss. Based on data it was the largest decline in Treasury prices in US history. But the collapse of risk markets and the slowing economy has caused a drop in the expected rate hikes from 10.2 to 7.53. In other words, the chances of the Fed raising rates to 3% is falling. This has caused Treasury bonds to stabilize and reverse course with higher prices.
The USD
Since the US dollar is the world’s reserve much of the worlds foreign debt is in USD regardless of the issuer. This also means that converting currencies into USD is a safe haven investment in a world of financial disorder.
The USD is also one of the best performing asset classes during recessions which I expect to arrive late this year or early next. It’s never a matter of IF a recession will arrive its a matter of when. The USD or USD ETF “UUP” has a -93% correlation to the S&P 500 this year. UUP should continue to rise as stocks fall.
In Summation: Market Volatility has reached a level of intensity where no rally can be trusted and the path of least resistance is down. In due time this will lead to a huge market rally but thats still many months away.
The US and world economies have slowed while in the midst of a multi-decade high in inflation. The Fed’s recent rate hike was the largest in 21 years (a dagger in the Dotcom bear market of 2001-2002).
The Fed has made inflation as its #1 priority but in doing so it will come at the risk of a further crash in the stock market. Jerome Powell indicated he expects two more hikes of .50% in the forthcoming meetings. Plus, the Fed will begin “quantitative tightening” in June – this means the bonds the Fed has been buying (which puts cash into the system) will be allowed to mature without replacement. If they stick with this plan it might be the most aggressive rate hiking policies since the early 1980’s.
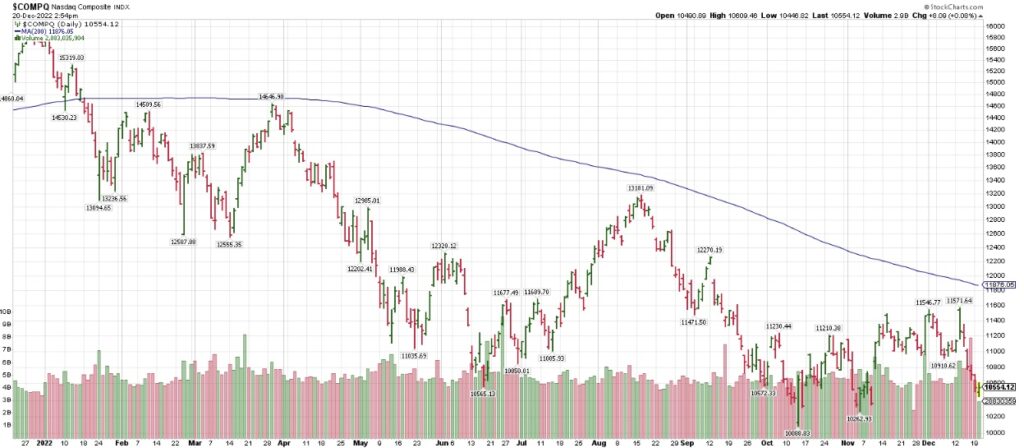
The Nasdaq composite index peaked in November at 16,121 and sits today at 11,757 a decline of 27%. But the damage to individual stocks has been much more severe. Declines of 75% to 90% will be common. Bitcoin has been taken to the woodshed and it may never return.
Thank you,
Brad Pappas
Client Update January 21, 2022 – Market Sell-offs Are Not Necessarily A Bad Thing
Market Sell-offs Are Not Necessarily A Bad Thing
(especially if you have a lot of cash)
January 21, 2022
US Monetary Policy aka the posture of the Federal Reserve which has the greatest impact on investment valuations will turn negative this year. Hence raising short term interest rates is causing the stock market to selloff in the near to intermediate term.
Adding fuel to the sell-off is the Empire Manufacturing Survey is signaling the economy will being slowing down.
While the short and intermediate term trend for stocks is negative. Going forward high quality stocks are declining in value that will eventually lead to a very good long term opportunity. So, while the main theme of my letter is negative for investments, long term this sell off will likely create excellent opportunities. Plus, having client account at approximately 80%+ in cash will allow us to take advantage of the opportunity when the time is appropriate.
The Fed’s objective is changing to fight inflation rather than prioritizing economic growth and employment. The consensus is for 4 rate hikes of .25% in 2022 and 4 more in 2023. A full 1% hike in short term rates is frequently associated with a short term 15% decline in stocks.
Due to the Fed’s new focus on raising short term interest rates, stocks have made a very hard pivot from Growth to Value. IMO, Growth and especially richly valued Tech stocks are in a Bear Market and untouchable for the time being. For example, the Ark Innovation ETF has fallen from $155 in February to $71 today.
This increases the odds of a market pullback to the 10%-20% range possibly in the first half of 2022 for the S&P 500. The Nasdaq Composite and especially richly valued Tech stocks could fall greater than 20%.
Aside from a special situation like ViacomCBS (which could be sold at +$60 per share this year to either Apple, Comcast, Amazon, Google) the Risk/Reward is unfavorable at the moment. But with stocks falling like lead weights they are progressively improving their risk/reward. More on the ViacomCBS situation below.
#1 The Growth Stock Bubble Has Burst: The anticipated end of the Growth stock bubble is at hand and not dissimilar to the bursting of the 2000 Growth stock mania. I have confidence in making this declaration because (just as was the case in 2000) the Federal Reserve is changing course which will have a significant impact on risk assets. They’ve created an enormously overvalued bond market where the “real” (real is interest paid minus inflation which is at 7%) is negative. 10-year Treasury yield was recently at 1.87%. 1.87% – 7% inflation = -5.13% real return.
The Fed and other Central Banks are in a “damned if they do and damned if they don’t” situation – a situation they’ve created themselves. They’ve created inflation which is not “transitory” in the short term and is compounded by supply chain issues and low unemployment-high wage growth (a major component of inflation). If they don’t raise rates inflation would likely run rampant which can lead to return of 1970’s style inflation. (I worked in a grocery store in the 70’s in charge of the coffee and cereal aisle. It was common to cross out old prices and add the new higher price more than just once a week)
Risk assets will decline – especially high growth related investments. This could include real estate but to a lesser degree. The increase in home demand and shortage in home construction make this a very tough call.
Raising interest rates are toxic to uber high valued Growth stocks since it increases the risk that future revenues and earnings will be reduced. Plus, using a Discounted Cash Flow model those high multiple earnings are not worth as much when risk free interest rises from 0% to 2.5%.
It’s conceivable that the broad based market indices could drop 20% or more this year. The cabal of Growth (Apple, Google, Microsoft, Netflix, Tesla) which have propped up the market since last February could face serious declines.
The valuation gap between Growth and Value is the highest since 2000. While the S&P 500 Growth index has a Price/Earnings ratio of 27, the P/E of Value is just 17. Last week Growth sustained the worst one-week loss relative to Value in 20 years. Bubbles burst quickly.
#2 The Pivot To Value: After the Growth stock bubble broke in 2000 there was a prolonged pivot to Value stocks that lasted for 7 years. However, Value stocks are still at risk in a sharp market pullback. They generally decline less than growth, so they are still at risk here.
Value stocks by and large are boring especially compared to Growth. But due to their inexpensive valuations they (in a broad perspective) are not nearly vulnerable to interest rates. Plus, according to Credit Suisse “S&P 500 Value is expected to deliver faster EPS growth than the Growth index (26% vs. 16%) in 4Q21 as well as in each quarter in 2022.”
Due to the 14 year dominance of Growth over Value, Value has a small footprint in the mutual funds popular today. Many mutual fund families offer no Value alternatives at all or have closed funds due to their lack of performance. It should be said that Value was not always a lagging investment style. The 1970’s and 80’s were dominated by Value especially during the mid 80’s take over frenzy of undervalued companies.
A key term in Value investing is the “Margin of Safety” concept. Hedge fund manager Seth Klarman wrote about the concept of “margin of safety” as it relates to investing years ago. It means that the current stock price is significantly below the tangible and intangible assets of the company. A stock that is so relatively inexpensive that its downside risk is likely limited. But, has an upside potential that is several multiples greater than the risk.
It’s very balance sheet oriented and frequently populated by companies where growth is subdued. There are no glamour stocks in the Value realm :). The Margin Of Safety (MOS) has nothing to do with short or intermediate term price movements. Its significance is in the long term.
A key investment rule I have is that when significant market sell-offs are finished the time is right to think longer term rather than short term. This means focus on quality at a reasonable price first. The farther we are away in time from a large sell-off the more shorter termed we’re focused on owning.
In November you could have bought Microsoft at $349 with the idea that “I’m a long term investor”. Well, now that its at $296 that seems pretty silly. But now, the sell-off has presented itself which changes our perspective to the long term.
The first selection in the high quality “Margin of Safety” realm is ViacomCBS.
ViacomCBS (VIAC) $32.5 a share with a 2.7% dividend with a viable chance for a sale of the company at over $60 per share.
VIAC is a premier media company with an extremely low valuation where the reward is potentially a multiple of the risk.
Viacom was built by Sumner Redstone who died in 2020 at age 97. His ownership was passed on to his daughter Shari Redstone. Viacom was once a dominant media company but in the last twenty years has been dwarfed by the group of Amazon, Apple, Comcast, Google and Netflix.
In March 2021 Archegos Capital was forced into liquidating their media holdings in ViacomCBS and Discovery. The sale was due to discovery of Archegos extreme and over-leveraged accounts. Shares were sold regardless of price and the shares of ViacomCBS which peaked at $99.99 fell to $36 within a month. The shares remained lethargic since then.
Shari Redstone is 68 years old and controls VIAC by her ownership of 79.5% of the class A shares. It’s likely she recognizes that critical mass (“size matters”) in the streaming business. Essentially, Viacom is a small fish in a very large and growing pond. While Viacom can earn close to $4 a per share share in each of the next 2 years long term growth is limited due to their inability to directly compete with the media Goliath’s. Current EPS estimates for ViacomCBS in 2022 is $3.90 a share.
What is changing the landscape for media companies is the increased present and future costs of Streaming media. A sale of VIAC to a company with abundant financial resources seems to be the odds on course for Ms. Redstone. While various measurements of the company show it might be worth as much as $75 per share using a sum of the parts valuation. A sale in the $60’s might be more likely.
The concept as it applies to VIAC is the valuation of the company at less than 9x earnings. A sum of the parts valuation that puts the potential value of VIAC to at least $60 per share and possibly $75. Much of the value is their legacy programming.
VIAC streaming business is growing faster than most of its competitors. They recorded almost $1 billion in streaming revenue with a 90% growth in subscribers.
Earnings are expected in the $4 to $5 range per years for the next three years which implies an extremely attractive valuation on earnings per share alone.
Insider buying? You bet. Shari Redstone and President/CEO Robert Bakish made large purchases in November and December at the $36 price range. Bakish has also publicly expressed his dismay at the current price per share.
While the odds are growing for a potential sale of the company the timing is impossible to anticipate. It’s possible that one morning we wake up to find a deal is complete. Therefore my intent is to hold the shares for a potential lengthy period of time.
If a sale does not occur, the forthcoming earnings in the next 3 years alone should generate a decent increase in share value.
“Deutsche Bank analyst Bryan Kraft upgraded ViacomCBS to Buy from Hold with a price target of $43 up from $39. The analyst believes Viacom offers “optionality” (meaning multiple ways to increase the share price). This includes valuation multiple rerating, greater success in streaming, and potential industry consolidation (a sale of the company) as Mega Cap Tech “sets its sights on becoming bigger streaming players”. Viacom’s enterprise value is a “fraction of that of the other four scaled content companies”. Yet, its annual content budget places it within range of the Mega Cap peer group. Kraft tells investors its his top pick in media.
From Dan Niles, Founder and portfolio manager of the Satori Fund, a tech focused hedge fund:
“I am an investor that likes stocks with growth at a reasonable price. VIAC trades at 8x CY22 PE despite their streaming revenues up 62% y/y. This is incredibly cheap compared to streaming leaders NFLX (46x PE; revs up 16% y/y in CQ3), DIS (~34x PE; streaming revs up 38% y/y in CQ3), and ROKU (~121x PE; revs up 51% y/y in CQ3.) These streaming leaders are all growing their streaming revenues slower than VIAC yet fetch much higher multiples. In addition to VIAC’s asymmetric growth vs. valuation profile, VIAC’s $1.1B in streaming revs in their September quarter grew to 16% of overall company revenues. NFLX is trading at 10x trailing sales. VIAC should do close to $5B in streaming revs this year, so it does not seem unreasonable to assume $50B is a reasonable valuation for this business alone. However, all of VIAC has a market cap of only $21B with ~$10B of net debt assuming current announced deals close.
From a subscriber perspective, NFLX had 214M subscribers at the end of Q3:2021 with a market cap of $267B. A valuation of ~$1,250 per subscriber. VIAC now has 47M streaming subscribers with 54M ad supported streaming subscribers from Pluto TV with a market cap of $21B. Just the value of the pure streaming subscribers for VIAC is $59B on this metric.
While we have admitted our mistake and cut our position in VIAC to take a tax loss for 2021, upcoming Q4 results and the outlook for streaming losses hopefully sets a bottom for the stock and sets the name up for a good rest of 2022. Investors may want to go to the sidelines until guidance is given on Q4 results or sentiment reverses for the company.”
Summary: We will continue to hold very high levels of cash until stability returns to the markets. The rate of decline in superlative stocks such as Apple and especially Microsoft make them attractive for long term holdings.
My focus is to use this selloff to focus on Quality above all else.
ViacomCBS is a wild card. Despite the potential for short term volatility (such as todays fallout from Netflix) the long term is very promising with the potential for a sale this year. ViacomCBS is a special situation and it will remain the only “special” holding we own.
Eventually this selloff will end. Preservation of capital and patience should be prioritized for the time being.
Thank You for reading,
Brad Pappas