August 9, 2021
Imagine watching a long bridge over water filled with traffic. The bridge appears stable and strong with no sign of weakness on the roadbed. But if you look below to the bridge foundation you see individual bits of brick, mortar and concrete fall into the water.
The bridge road surface is still stable but for how long? And, would you be willing to cross it?
This is my attempt at an analogy of the broad market indices today. Markets are stagnant but stable on the surface. However severe erosion exists beneath the surface which has made investing increasingly difficult. Trades that normally would hold value after a few days are reversing after days 2-4.
For example, the Nasdaq 100 made a new all-time high today (8/5) but only one stock from the index made a new high as well: Costco.
In this letter I show how there have been several periods like this in the past. While its not 100% assurance that a good sized sell-off ensues, its a high probability occurance. Periods like today with eroding stock participation are before sell-offs in excess of 5%-10%+.
From my observational view when I run into trouble buying into a series of high probability trades that end up not working out, I stop. By stopping I want to see why my textbook entries are not working out as they should in a healthy market. Recently there have been a few textbook trades that are strong on day1 but run into trouble after day 2 or 3. Whats happening?
What is happening is that big institutional firms are selling into the rallies rather than making additional buys that can propel the stock higher. We’ve had cases where this has not happened such as with Adobe, Align Tech or Cloudfare. But we’ve taken enough small losses to force me to pause.
Bob Farrell is Old School. He was the Chief of Technical Analysis at Merrill Lynch when I first broke into the business in the early 80’s. In his Ten Lessons of Investing is the following quote:
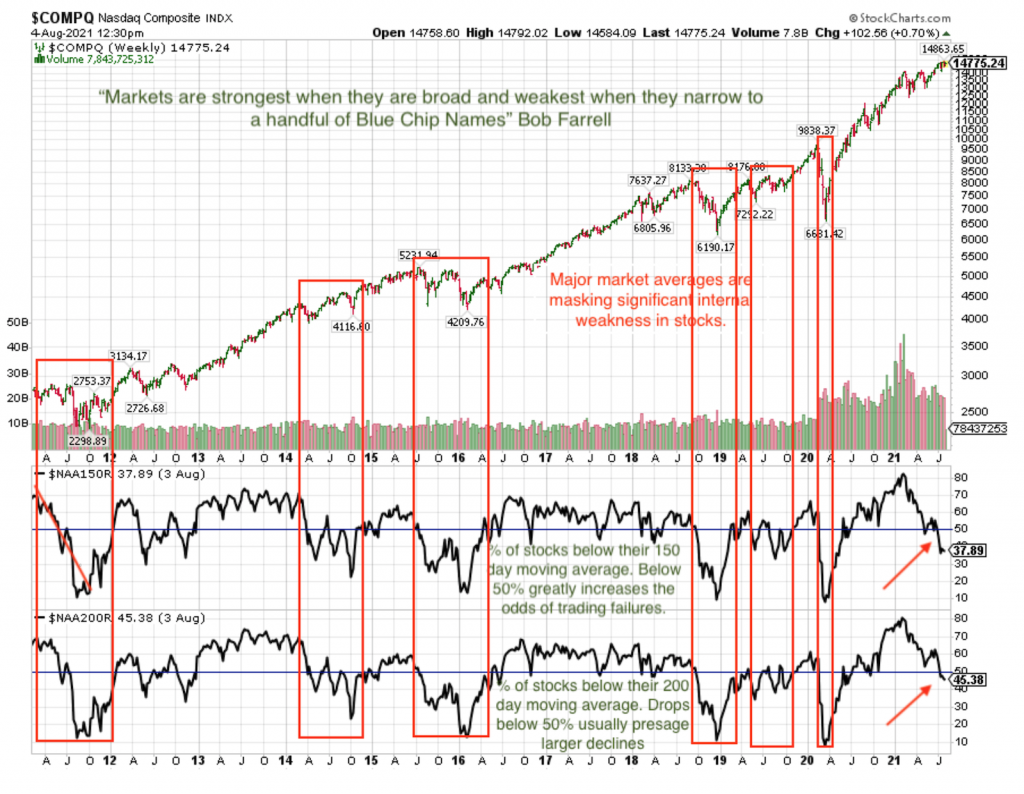
“Markets are strongest when they are broad based and weakest when they narrow to a handful of blue-chip names.” And that describes exactly where we are in August 2021.
Since July, equity markets have become a chop-fest. Up, down, up, down with zero consistency while the percentage of stocks above important moving averages continues to decline.
This erosion in the markets is being masked by the largest % weightings in the S&P 500 index. The S&P 500 is not a group of 500 companies weighted equally so it’s possible to prop up an index with heavy buying of the highest weighted stocks.
Apple 5.5%
Microsoft 5.3%
Google aka Alphabet A & C shares 4%
Amazon 3.9%
Facebook 2.2%
At the moment we are time period where companies are reporting earnings and expectations for the second half of the year. And, there is a trend emerging in which Amazon, UPS, Facebook, Apple are reporting that the first half of the year revenue growth was unsustainably great that it was borrowing from the second half of the year. In other words, all 4 companies that benefited from the Covid crisis are expecting declines in demand and revenues for the second half of the year.
In addition, we can expect the Fed to begin easing off their purchases of Treasuries and Mortgage backed securities – as if the real estate market isn’t hot enough.
These are my thoughts as to why we could experience a sharp down move in stocks in the coming two months – August and September happen to be two of of the worst months for stocks. But at this point these are opinions that have yet to be validated by the markets.
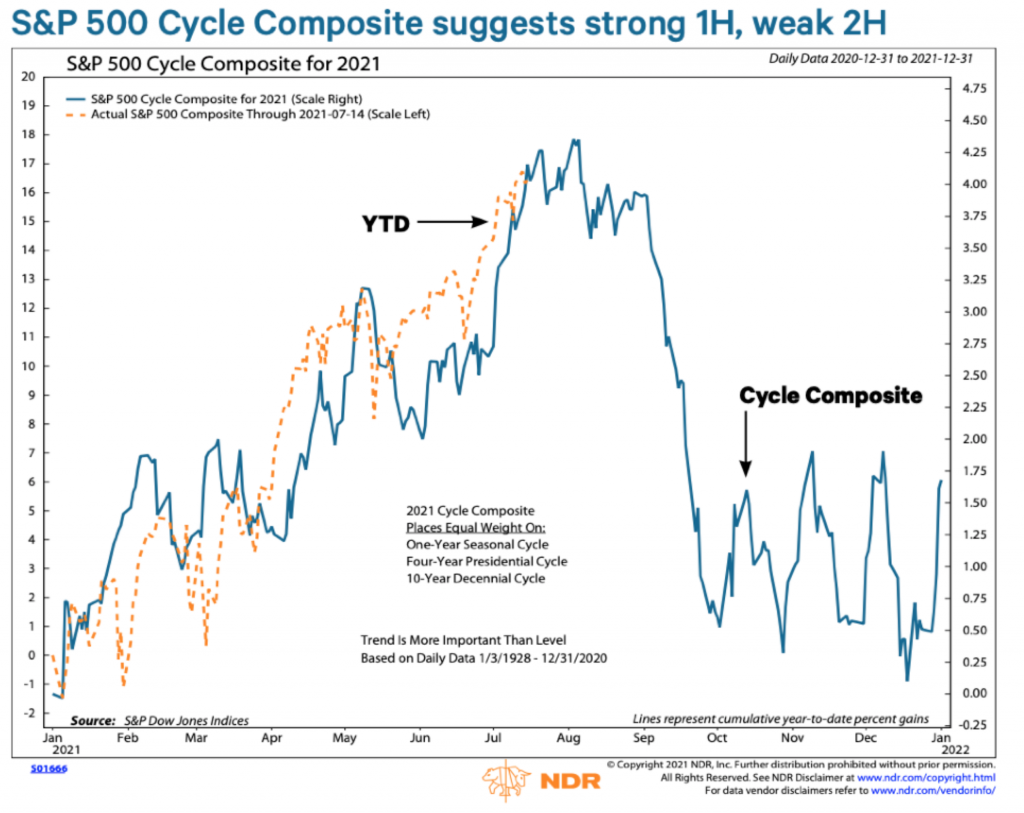
Based on the chart below, the cycle peak for stocks was last week. Maybe its accurate, maybe not. It’s interesting regardless.
Now lets drill down to facts:
The Nasdaq composite remains elevated but without serious weakness at the surface. This is due to the pegging of Google, Apple, Microsoft, etc expressed previously.
Below the surface to individual stocks there is a very different story. Serious erosion in the average stock while the indices remain high. As the chart shows this is not a rare occurrence but it usually leads eventually to significant market weakness.
The percent of stocks below their respective 150 and 200 day moving averages (dma) continues to grow. The Bob Farrell quote comes to mind here.
What is happening is that investors are cutting their losses in stocks and then shifting the assets to FANG + M (Facebook, Apple, Netflix, Google and Microsoft). In a sense they’re hiding in extremely large and liquid shares.
If there is a serious market decline those who’re buying FANG + M will sell those as well.
Another method of analyzing the erosion in participation (market breadth) is the Nasdaq McClellan Summation Index (NASI) which has clearly been on a Sell recommendation since July.
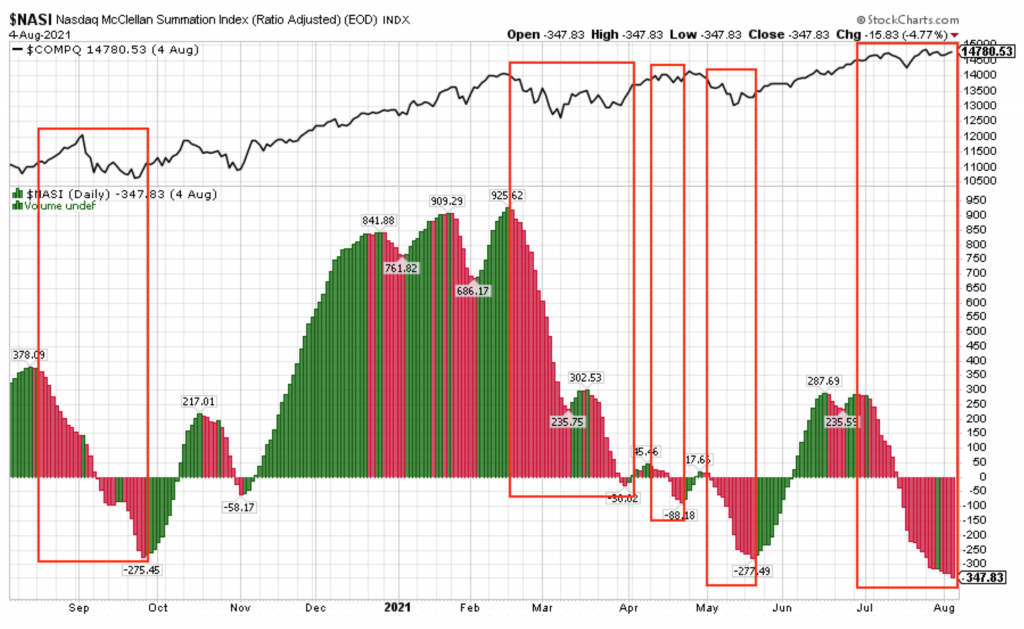
Every major market pullback in the last 20 years show declining market breadth before the bulk of the selling began. However, not every period of declining breath presaged a sizable market pullback.
Should market breadth begin to improve, I plan on increasing our percentage invested. In the meantime its very difficult to sustain meaningful gains with the current erosion in stock participation.
Like everything else market-wise this is a temporary condition. Its just not an ideal time to be aggressive and fully-invested.
Thank you for reading.
Brad Pappas
August 9, 2021