RMHI Client Letter, December 2025

“If you wait till you have all the information the battle is lost”

Admiral Raymond Spruance at the battle of Midway.

Stock valuations are higher than ever before including 1929, 2000 and 2007. Assuming an investor buys and holds an S&P 500 index fund when the stock market was valued at 23x earnings, the 10-year average rate of return range falls to +2% to -2%. However when US stocks are selling at 25x earnings the 10- year return was negative.

When market valuations eventually revert (as they always do) lower, the losses will be huge and life altering.

RMHI does not blindly believe in buy and hold, especially when markets are at extreme valuations.

Socially Responsible Investing, Vegan Investing

My expectation is that over the next 10 years there will be several significant declines and several rallies. In other words a choppy decade for stocks.

This is the reason why there has been above average activity in client accounts as I’ve reduced stock market risk.

The peak last month looks deceptive as it was not a reflection of the average stock making new highs aka “Rising tide raises all boats”. It was based on the strategy of “Invest in AI or go home”. Meaning that the momentum of AI related stocks was alone in propelling the market higher.

If an investor was of the opinion that AI has such a long way to go and to sell now is foolish. That investor may be right but history is replete with mass hysteria of believing “trees will grow to the sky”.

On October 15, 1929 Yale’s Irving Fisher infamous claim: “Stock prices have what looks like a permanently high plateau”. Just 9 days later on October 24, 1929 was “Black Thursday” when the stock market lost 11% of its value on the opening bell with further losses in the weeks following.

In recent times “We see no indications in the marketplace that the radical internet business transformation…is slowing – in fact we believe it is accelerating globally.” John Chambers Cisco Systems CEO August 2000. “…we experienced parts shortages because of industrywide capacity constraints and unprecedented demand for our communications products.” Agilent CEO November 2000.

Based on momentum we have experienced during the first nine months and the strong order backlog , we continued to expect that our growth in 2000 over 1999 will be in the low 40%’s.”

Nortel October 2000 press release Nortel filed for bankruptcy January 2009.

Agilent didn’t go out of business but sold its original electronics business.

Cisco Systems exists today. Cisco’s stock price peaked at $53 in 2000 and fell to $5 in 2002. It did regain its 2000 market price once again…..in 2021.

Blackwell sales are off the charts, and cloud GPUs are sold out”. “We entered the virtuous cycle of AI. The AI ecosystem is scaling fast”. Nvidia CEO November 2025.

A reminder that former tech leaders usually don’t see the cliff ahead.

All the quotes above are Bubble-Speak. These quotes only speak of demand for products and do not reflect the profitability of the end users. If the end users profitability is as poor as current estimates are pointing then the manufacturers will face price competition since demand will be reduced and eventually less expensive providers will come to the forefront. All the while AI could continue to be of great service.

These Bubble cycles eventually do pop and the history of these cycles goes back hundreds of years.

It remains to be seen what will happen to AI investments going forward but such effusive language should generate concern and caution for those old enough to have been around in 2000.

Consider insider selling at Nvidia: in the past six months there have been 527 sales by insiders totaling $1,906,942,689. Source: Dataroma

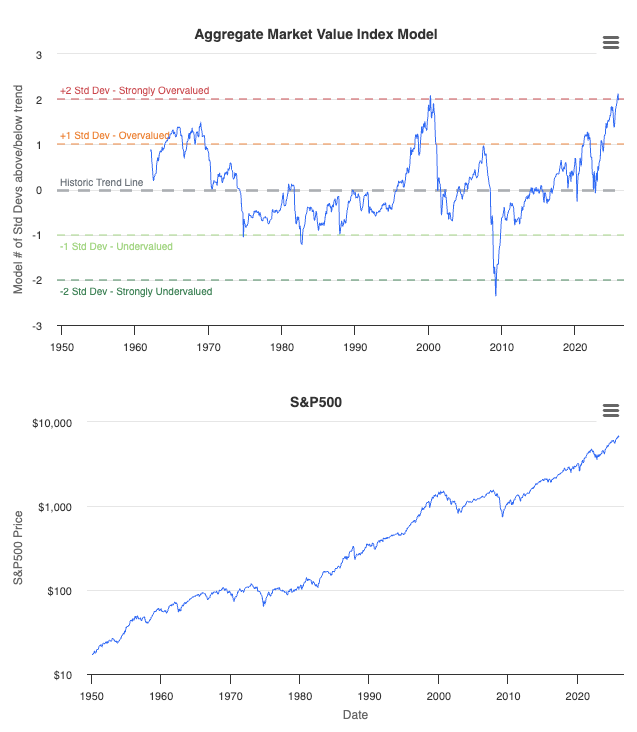
Below is the Aggregate Market Value Index from Currentmarketvaluation.com. It’s a composite of several valuation methods which show a correlation to future returns.

It states we are two standard deviations above historical valuation norms. It’s not a short term timing model but provides a macro perspective on risk/reward. There has never an era where such an extended market valuation produced positive forward returns for extended periods of time.

At times like this, minimal or risk free returns on Treasury bonds or high quality bonds become a better alternative for extended time periods. As the old bromide goes: “better a modest return on capital than the risk of capital returned.”

Socially Responsible Investing, Vegan Investing

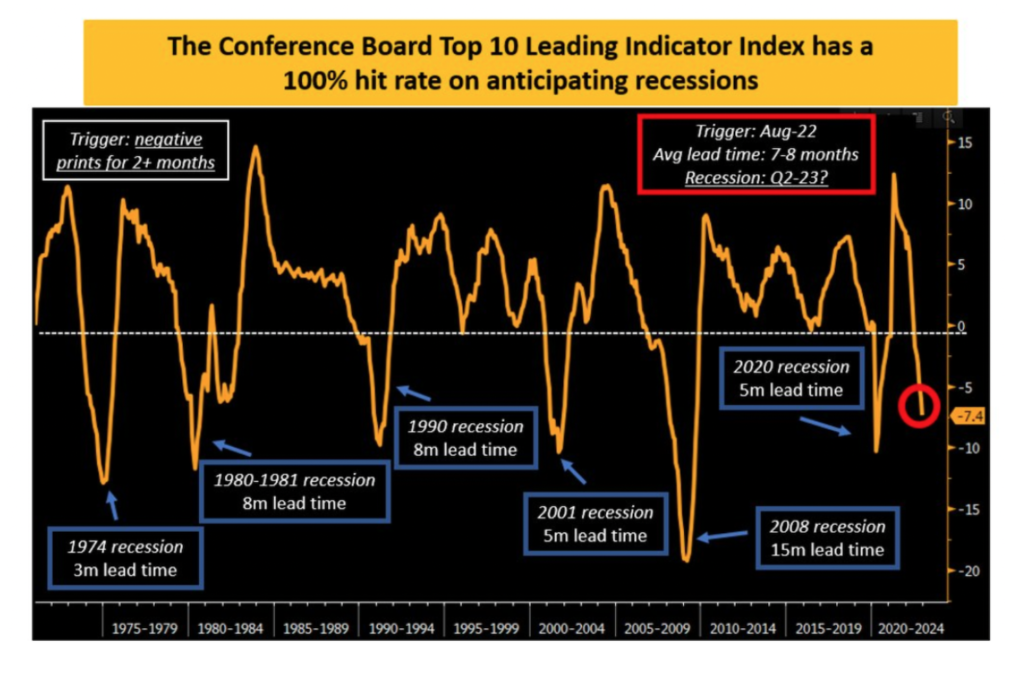
What else is concerned about? The slowing economy and growing unemployment.

Recessions are difficult to predict but we are heading that way. We’ve already reached the point where growing unemployment usually leads to recessions. But, AI infrastructure spending is close to 50% of GDP. Without AI spending we would likely already be in recession.*. AI may contributed to close to 50% of US GDP growth in the first half of 2025. Source: BCA Research

Kevin Hasset is the front runner to be the new head of the Federal Reserve and he has been vocal for aggressive interest rate cuts. In my opinion this may be the reason why stocks continue to move higher. And, aggressive rate cuts are likely positive for Gold.

Socially Responsible Investing, Vegan Investing

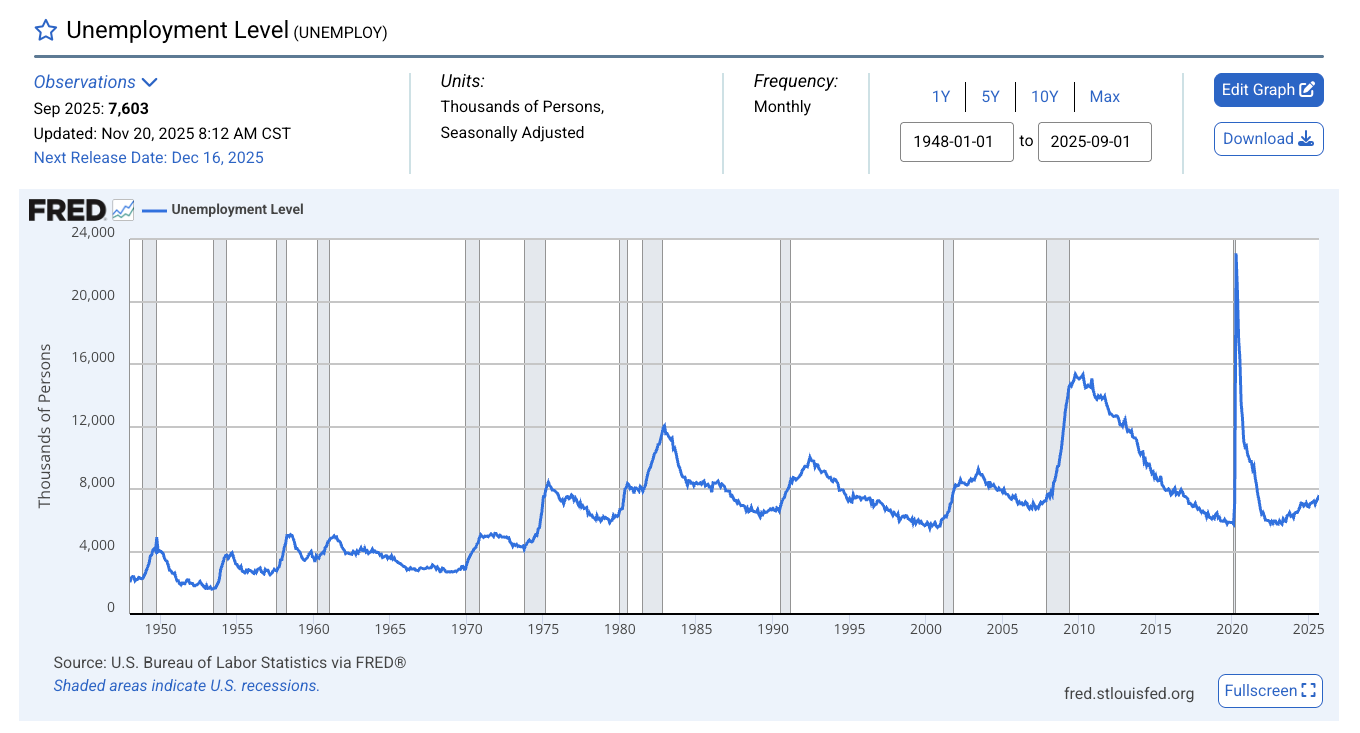
The trend in unemployment growth is concerning. Because of the government shutdown October employment data will not be published.

Below is the Unemployment data from the Federal Reserve. Notice the move higher on the far right of the chart that has historically evolved into a recession.

Since we are nearing the end of the tax year, taxes must be taken into consideration. Many of the recent trades were to capture tax losses to offset gains from earlier this year. Losses are taken in both taxable and unaffected non taxable accounts at the same time.

Socially Responsible Investing, Vegan Investing

Shares of Applovin, Robinhood, O’Reilly Auto were taken in whole. Partial gains were taken in some of the more volatile names such as Arista, Amphenol, Broadcom, Celestica, Comfort Systems, Interdigital and Sterling. All of these stocks have AI exposure and are likely overvalued but they continue to power higher.

Since stocks are quite overvalued I have cut our exposure and have been seeking high quality bonds and treasuries.

Recently I added a 5-year Treasury to portfolios with a yield of 3.48% but I’m also looking for safe yields higher than what Treasuries offer.

Adding Janus Henderson AAA CLO ETF Symbol JAAA: This is a AAA rated (the US is AA rated) Collateralized Loan Obligations.

This Exchange Traded Fund is a very conservative alternative to Treasuries. It pays a present yield of 5.49%.

The fund buys the highest rated loans which are “floating rate”. Floating Rate means the interest rate on the loan will change according to the direction of interest rates. This prevents the ETF from losing value should interest rates rise. Since its of the highest rating possible with low downgrade or interest rate risk its a worthy alternative to Treasuries.

Socially Responsible Investing, Vegan Investing

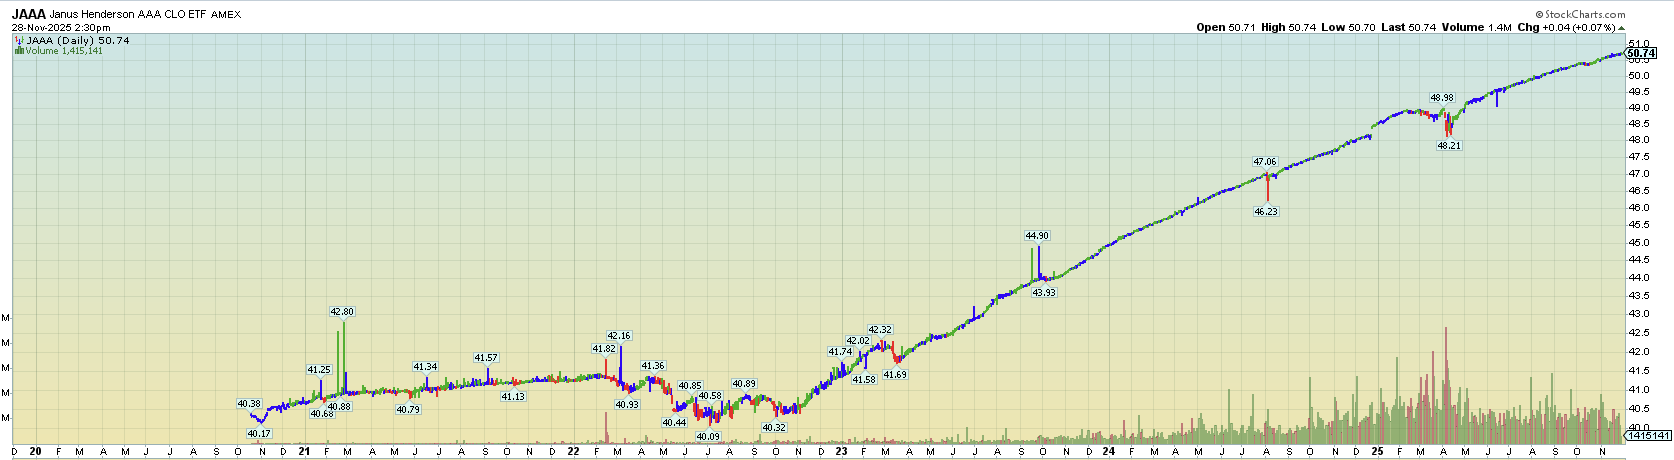
The chart above shows the trading history of JAAA. Note that in the market weakness of 2020 the fund sold off by about 5% at its worst. This can be due to several factors unrelated to the fund. Most of the time its from funds needing to raise cash. These periodic weak periods are excellent buying opportunities.

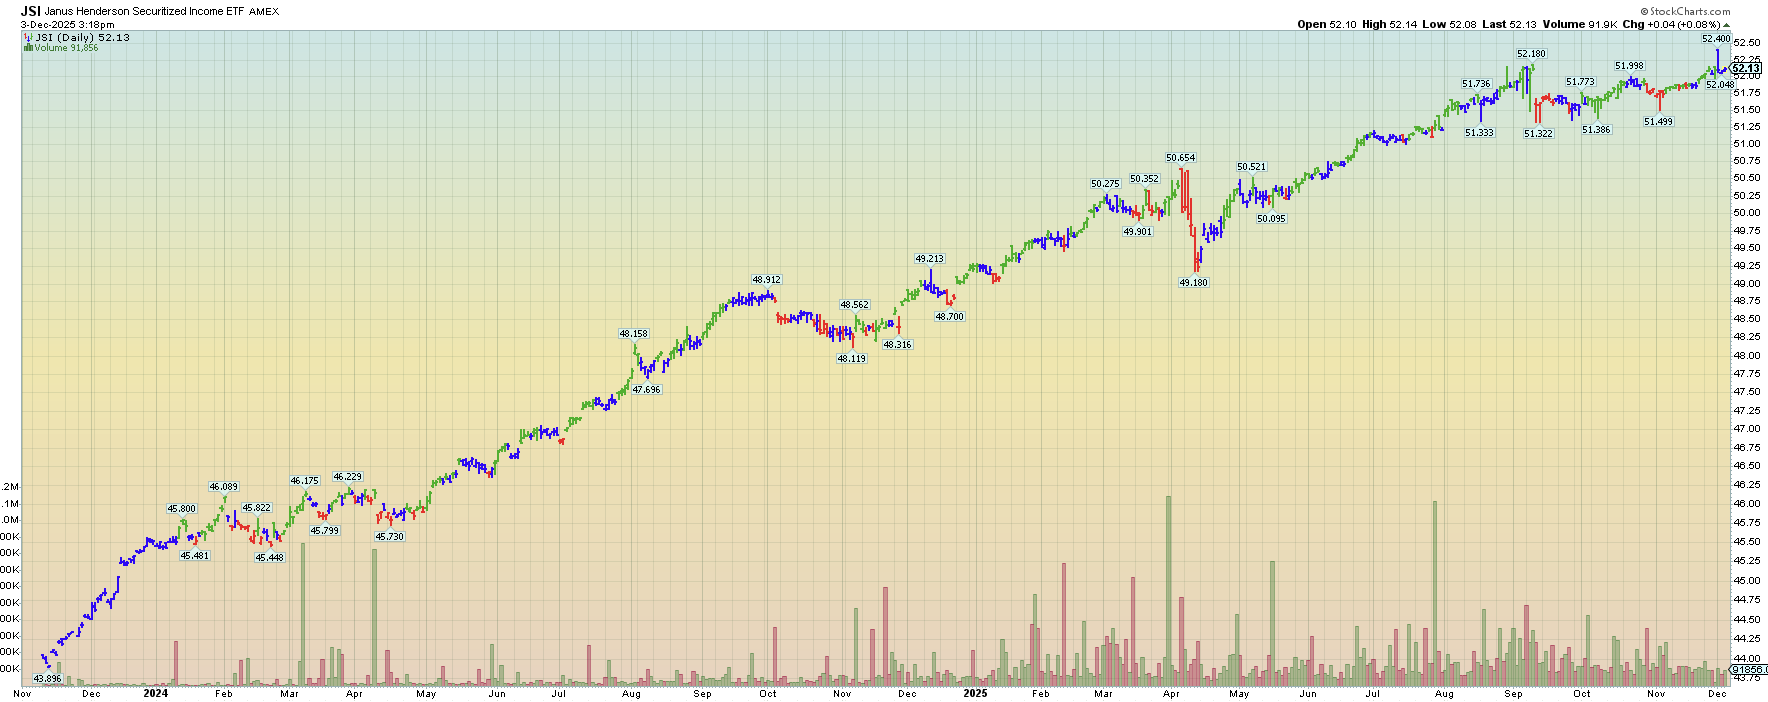
Adding Janus Henderson Securitized Income ETF symbol JSI: It invests in very high rated securitized bonds. They primarily own bonds from Fannie Mae aka Federal National Mortgage Association. Current yield is 5.79%.

Socially Responsible Investing, Vegan Investing

Following The Money

Money tends to flow to assets that offer better reward potential. The decline of the US dollar is causing funds to leave the U.S. in search of better opportunities.

According to Seabreeze Partners AI investing represents 42% of the S&P 500 index. So if the AI trade is showing signs of fraying the volatility could become severe in the U.S..

Under the radar is the fact that Latin American stock markets are having a very good year propelled by the weak USD. Brazil in particular. In Latin America the valuations of their markets are at a fraction of the U.S. Brazil trades at 8x earnings compared to 25x for the U.S.

So I’ve added three essential stocks from Latin markets. And, back to Constellation Software which is Canadian.

By “essential” I mean non cyclical companies that provide basic services with reliable revenues and earnings.

America Movil symbol AMX: We’ve owned AMX before in the early 2000’s. They provide telecommunications services to Latin America and internationally.

Companhia De Saneamen symbol: SBS. SBS provides basic water and sanitation services in Brazil for the San Paolo state. Founded in 1954 and it has been a stellar performer for a very long time. I’ve followed them for years waiting for an opportunity which has now presented itself.

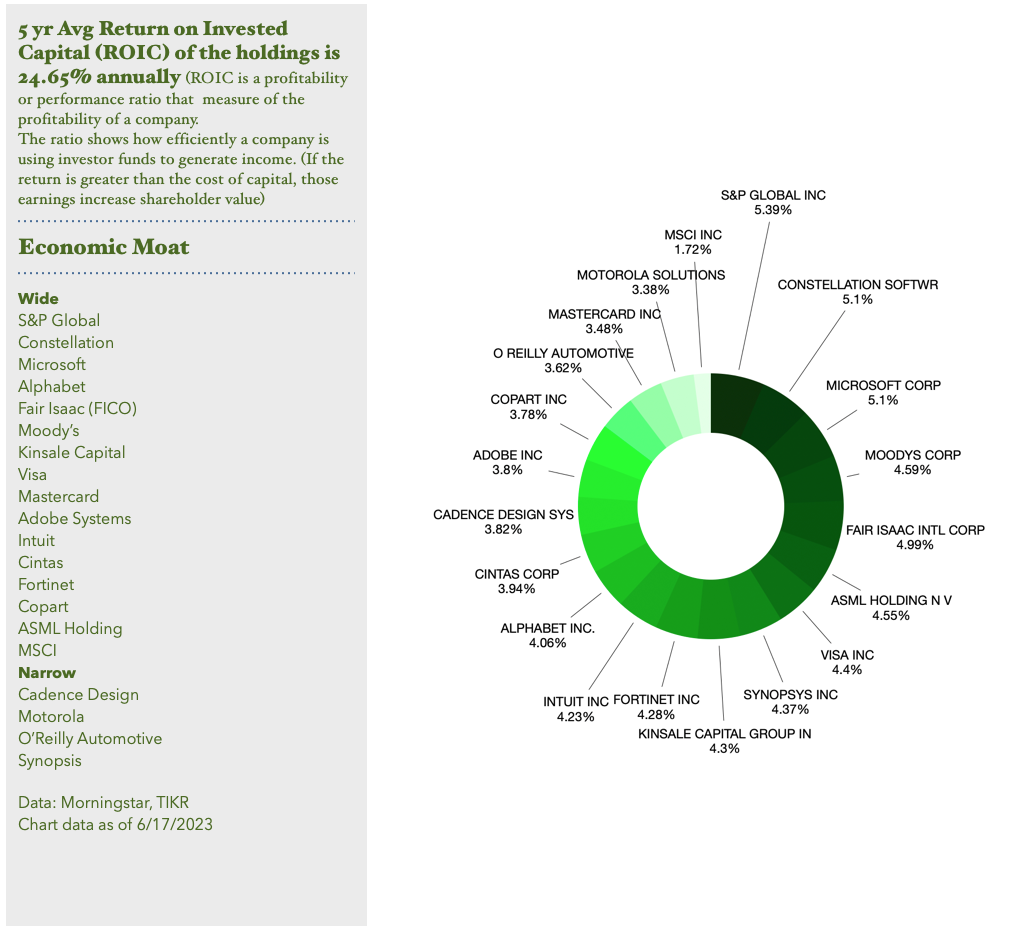
Nu Holdings symbol: NU, Nu provides a digital banking platform in Brazil, Mexico, Colombia, Cayman Islands and the U.S. Revenues for NU have been growing exponentially since they went public in 2018. NU became profitable in 2023 and has a stellar 27% return on capital.

Constellation Software symbol: CNSWF. Constellation has endured the deepest price pullback in its history. Shares peaked in May at $3996 and a bottom may be in place at $2235.

Reasons for the selloff were two fold: The quick resignation of founder and CEO Mark Leonard for health reasons. And, the theory that AI will transform software creation making Constellation irrelevant. Since the shares have declined by 52% and if a peak in AI investing is occurring shares of Constellation would rebound in 2026. If it falls to new lows I’ll sell.

Quick Summary: I’m expecting U.S. stocks to revert back to normal valuations at some point. I think its a fools game to try to wait till the last minute because we never know when that minute is occurring.

Prolonged Bear Markets in U.S. stocks do have significant rallies to participate in as long as you kept your funds and psyche intact. In the 2000 Internet bubble an excellent and prolonged rally occurred from 2003 to 2007. Similar rallies occurred in the 1930’s and 1970’s.

My goal is to find the acceptable investments during what is likely to be a difficult future for stocks.

Gold and Silver, high quality international stocks plus safe Treasuries and other bond ETF’s are likely at the front of the list.

Thank you for reading.

Brad Pappas

12/3/25

Disclaimer: The purpose of this letter is solely for the dissemination of information investment products or services. Investment advice or the rendering of investment advice for compensation will not be made absent of compliance with the state investment advisor requirements. For information concerning the compliance status or disciplinary
history of advisor or firm the consumer should connate their state securities law administration. 

The information contained in this letter and email should not be construed as a financial or investment advice for any subject matter. Rocky Mountain Humane Investing, Corp. expressly disclaims all liability in respect to actions taken based on or any of the information on this email.

As always, past performance is no guarantee of future success or returns. In fact future returns may be negative or unprofitable. Accounts managed by RMHI are not diversified. Meaning they own less companies than a diversified fund. Thus the portfolios may be more exposed to individual stock volatility than a diversified fund.

RMHI Client Letter,Sept 17, 2024

RMHI Research Letter
Sept 17, 2024

The Dark Side of Long Term Investing and how to stay in the Light

Since 1996, RMHI has been an independent investment advisor.  We have never been beholden to conflicts of interest from the mutual fund or ETF industry.   We are able to think and research freely for the best possible solutions to investing and associated risk. 

We are able to invest without packaged products that include an additional layer of fees to the fund company.  This allows RMHI to invest client money with greater investment objectivity.  In other words, we’re able to invest with successful investment strategies and protect the downside risk when applicable.

For almost 30 years I have been a Fiduciary to my clients with two primary objectives: to grow client capital within the boundaries of our Humane criteria and preserve that same capital.  And, for most of my career in investment management I’ve been researching methods to reduce downside risk to investing in the stock market.  Reducing risk becomes increasingly important as we get older and don’t have the time to recover losses like we used to.

The information below is absent from a large majority of clients in the Financial Planning, Mutual Fund – ETF industry.  If you’ve read typical Mutual Fund / ETF sales literature you’ll no doubt come across bromides such as “Its time in the market not timing the market”We’re investors for the long term” and my favorite “If you miss the ten best days/ years of the stock market your return will drop to __’”.  (The fund companies never say how much your return would be if you MISSED the 10 worst days)  None of these feel good mantras will ease your angst in a -30% to -50% bear market in stocks.   

A -30% to -50% decline in the stock market takes years to recover.   If the investor sold in panic (never smart to do) it will likely take even longer.   The panic seller has to overcome both ego and fear before considering reinvesting.   In this case it’s highly likely the markets will already have recovered before the panic investor thinks it’s “safe” to reinvest. 

After the 2008 market collapse former manager of the Harvard Endowment, Mohamed El-Erian made the following statement: “Diversification alone is no longer sufficient to temper risk.  In the past year, we saw virtually every asset class hammered.  You need something more to manage risk well.”  Without a doubt the best risk aversion strategy is to hold assets in cash/T-bills during a crisis.

The math of a large loss:  If you lose -50% of your principal it will take a +100% return to break even.  Even a loss of -30% takes a +44% return to break even.   In both instances it takes years to get back to the high water level of your account.   

Whereas if you took a modest year end loss of 10% it only takes an 11% gain to break even.  Generally speaking when bear markets transition to bull markets it will only take months to regain your high water mark.

This type of research always reveals the conflicts of interest with the mutual fund and ETF industry.  Every ETF and mutual fund company needs their investors to stay invested in their funds at all times, otherwise the fund can go out of business.

If investors were aware of effective risk reduction strategies (especially valuable for IRA’s) many funds and ETF’s would see significant selling and withdrawals.   In my opinion, this is the primary reason that risk avoidance strategies are not presented to their investors.

For those that insist that long term market timing is impossible (I agree that short and even intermediate timing is impractical).   I will be providing data and information from the following sources:

Gerald Appel of Systems and Forecasts

Mebane Faber.  Spring 2007, The Journal of Wealth Management.  “A Quantitative Approach to Tactical Asset Allocation”

Professor Jeremy Siegal’s: “Stocks for the Long Run” Sixth edition

Faber’s requirements for the system are basic and not optimized.  (Optimization almost always leads to failure of the system.)

1.  Simple, purely mechanical logic.
2.  Price based only.

What are not included are opinions, emotions or any subjective analysis.   I’ll be including charts in three primary time frames which are the same time period: 200 day simple moving average and 10-month moving average.    

The chart of the model that Mebane Faber and Professor Siegal have researched and published is listed above.  A very simple determination whether to own stocks or hold funds in cash.  If the S&P 500 is above its 200-day moving average you should own equities.   If below, the investor should be in cash or T-bills.

In Figure 5 we can see the maximum drawdowns for the stock market.

Figure 8b shows the reduced drawdowns if an investors used the Siegal/Faber system.


Positives:

This model will help you avoid most bear markets. 

The more volatile the stock market generally the more effective the signals.

Cons:

While it keeps the investor out of stocks in the worst of bear markets it can cause false sell signals.  Many of the false sell signals occur during low volatile market uptrends where the market sticks close to the 200 day average.  To counter this  Dr. Siegel suggested to only buy or sell if the market is greater or lower than 1% off the moving average.  But in my research Dr. Siegel’s recommendation is not satisfactory.

In both Siegel’s and Faber’s research they use the 200 day moving average as a stand alone model.   From my years of research and experience stand alone models need further confirmation from other indicators. 

RMHI solution:

Pair the 200-day moving average with the Gerald Appel’s MACD model.

The MACD or Moving Average Convergence Divergence was developed in the 1973 by Gerald Appel of Systems and Forecasts.  The MACD contains two moving averages: a short and longer term moving average.  When the short crosses below the long, a Sell signal is generated.   And, if the short moves above the long, a Buy signal is created.

When the MACD and 200 day moving average are paired many of the weaknesses of the 200-day moving average are eliminated.   

Both models must concur with each other.  If either model triggers a sell it must be confirmed by the other.

When our dual model system generates a Sell signal.   Stocks should be sold and those assets should be invested in Treasury bills.   Many other types of bonds and debt are usually heavily sold during recessions and bear markets.

The following charts below provide detail to the paired model Sell signals.  Our dual model system confirms the market top in October 2000.  The trend remained negative till the Spring of 2003.  

devastating peak to trough decline of approximately 50%.  It’s interesting to note that the high of the S&P 500 in 2000 was 1553.  The 2000 market top wasn’t reached again till 2007.  It then fell to 666.79 at the bottom in 2009.  The 1553 peak from 2000 was not surpassed until 2013.

They’re never a matter of “if” a big market decline will occur it’s just a matter of “when”. 

The 2008 market crash is depicted below with confirmation of the S&P 500 knifing through the 200-day moving average and confirmed by the MACD in the lower portion of the graph.  The sell signal occurred after the first leg of the decline.   

In the chart above, the shallow market declines in 2010 and 2011 did not trigger Sell signals.  The declines were not confirmed by the MACD in the bottom portion of the chart.   Unconfirmed market declines have a tendency to be short in duration and depth.

Trend models such as ours only react after a change in trend has been identified.   Meaning, they won’t get an investor out at the very top nor in at the very bottom.

One weakness to the MACD and our system is that during years of low volatility Sell signals have been modestly successful.   In the chart above the 2018 signal followed several years of low volatility.   The rising slope of the market rally from early 2016 was modest.    This modest but consistent rally can be contrasted to the vigorous rally in 2020 and our present rally in 2024.  This quality reinforces the concept that our paired RMHI system is of special value for the severe Bear markets.

Where do we stand today?

Two interesting points on this chart.  The fall 2023 selloff went below the 200 day average and the MACD confirmed.   But there are times when a bit of experienced judgement needs to be used.   We were clearly coming off the 2022 market low and the slope of the 200-day moving average was positive.   

As the end of August 2024 both indicators remain positive.   The August dip to the 200 day or 10 month moving average was unconfirmed by the MACD and the 200-day moving average had a positive slope, so no signal.

While there was no signal there is evidence of slowing market momentum.

Summary:  The financial advice industry’s standard boilerplate message is that investors should be invested (on offense) 100% of the time and that any form of market timing is ineffective.   Clearly this presentation proves how wrong that logic is.

All market rallies have a definite lifespan and obviously there are times when there is a need to be defensive and cautious.

Investors should think in terms of offense and defense when it comes to long term investing rather than having continual risk exposure.   Being fully invested at all times can be devastating in Bear markets.

As investors age closer to retirement the emphasis of defensive investing should be a higher priority.    This is especially true when a Bear market can erase years of gains in short order and take an additional years to recover.  For example,  the 2007-2008 Bear market didn’t fully recover till 2013.

The primary goal of the system presented here is to reduce volatility and avoid significant market declines.   However as anyone in my profession can attest there is never a guaranteed assurance that its reliability will continue in the future.

The system presented here has a secondary potential benefit of increased annual returns: Over the past 65 year the average rate of return on stocks has been 10.2% from 1957 to 2023.   But in those 66 years there have been many severe market declines, which are factored in the average return.  Could avoiding even 2 or 3 declines help performance?  It’s possible but is based on the number and degree of severe market declines and the investors accuracy to reinvest determines the result.

Brad Pappas
September 2024

Disclaimer: The purpose of this letter is solely for the dissemination of information investment products or services.  Investment advice or the rendering of investment advice for compensation will not be made absent of compliance with the state investment advisor requirements.  For information concerning the compliance status or disciplinary history of advisor or firm the consumer should connate their state securities law administration.

The information contained in this letter and email should not be construed as a financial or investment advice for any subject matter.  Rocky Mountain Humane Investing, Corp. expressly disclaims all liability in respect to actions taken based on or any of the information on this email.

As always, past performance is no guarantee of future success or returns.  In fact future returns may be negative or unprofitable.   Accounts managed by RMHI are not diversified.   Meaning they own less companies than a diversified fund.  Thus the portfolios may be more exposed to individual stock volatility than a diversified fund.

RMHI Client Letter, July 16, 2023

RMHI Client Letter and Fact Sheet
July 16, 2023

RMHI is a Colorado based state registered investment advisor that manages portfolios for Balanced and Growth investors.  RMHI established the first Cruelty Free Investing policy in the US in 1996.  RMHI manages a concentrated investment strategy that focuses on Free Cash Flow factors.  To be considered for investment a company must have consistent free cash flow growth, maintain positive free cash flow margins and consistent Returns on Invested Capital (ROIC) above 15% on average.  We add one technical measure of the stock’s stability relative to the S&P 500 over at least a decade.   We prefer stability over volatility.   Our goal is to minimize capital gains and transaction expenses by focusing only on companies that are capable of compounding value internally and by share price over a multi-year period.

socially responsible investing

One of the most common questions I receive is “Why is it better to receive little or no dividends on my stocks than owning stocks that pay higher dividends?”  It’s a reasonable question but the answer lies in the internal rate of growth in the company created by a high reinvestment return.   

The chart below shows the internal growth of a company with a Return on Invested Capital (ROIC) of 20% per year with no dividend.   Since there is no dividend there are also no taxes to be paid.

Socially Responsible Investing, Vegan Investing

The second chart below shows a company earning the same 20% on its ROIC but pays out 75% of its earnings in the form of dividends.  In this example the dividend paying company has Compounded Annual Growth Rate (CAGR) of 5% versus the CAGR of 20% for the zero-dividend company.  Not to mention that the dividends could be taxable

Despite this example many of our best holdings do pay dividends.  My preference is for companies to pay less than 25% of their net income in the form of dividends.   

In the past 30 days, two holdings were sold off with a modest loss and gain.  A company may be of the highest quality but if the stock cannot gain or it loses traction a decision has to be made.   A company that was sold for a loss can be reconsidered after 30-days.  If we repurchase within 30-days we lose any benefit of the tax-loss (for taxable accounts only).

Sales

Accenture ACN:  Cost was $308 and sold for $300.   Accenture had been downgraded by several brokers as future bookings are weakening.  Plus, the most recent earnings were positive but partially due to reduced tax rate.

Monster Beverage MNST: Average cost estimate of $53 and sold for $55.  The chairman of Bing Energy beverage passed away recently and Monster will be buying the company.   This purchase is the likely cause of the recent price weakness.   Growth appears to be slowing.   In 2020 their Return on Capital was 31% and in the last 12 months it has dipped to 22%.   Monster does not have a Wide Moat so competition could be having an impact.

Buys

Mastercard MA:  I’ve used the proceeds from the sales of ACN and MNST to fund the purchases of MA.  Mastercard operates as a duopoly with Visa and was in my opinion the best company to own which wasn’t in our portfolios.   The reason it was initially left out was its flat trading range for the past 3 1/2 years and the chart below shows it appears to be ending its dormant phase.  Due to its high ROIC the value of the company continued to rise internally.  Since the stock traded sideways it became a relative value due to internal growth.   Over time I’d like to add to MA since our total position is relatively small.

Investment returns for Mastercard are quite special:  MA went public 17 years ago and has returned 8353% in that time.   The compounded annual growth rate is 29.7%.  Since going public 17 years ago MA has outperformed Visa especially since 2016.

“Despite the evolution in the payment space, we think a wide moat surrounds the business and view Mastercard position in the global electronic payments infrastructure as essentially unassailable.  (Morning star)

Mastercard is one the best examples of what happens to investment returns when you have a strong and “unassailable” Moat.   What drives the price in MA shares is the incredible Return on Invested Capital of 60.8% for the past 12 months.  (Source TIKR)

In my opinion Mastercard is another company where it’s never made sense to sell, ever.  IMO the best place to look for companies that can deliver relatively smooth long term returns are with companies already doing so.

Update from Barron’s magazine for July 16, 2023:

“Mastercard and Visa have been on a tear and yet their stocks remain cheap.  Investors should take the opportunity to scoop up shares according to Nicholas Jasinski writes in this week’s edition of Barrons.  Visa’s current valuation multiple is a premium of about 30% over the S&P 500, half the historical average of roughly 60%.  The picture is similar for Mastercard – its cheaper relative to the market and its own history than it has been in a while.  Nothing appears to have changed for either company to warrant a multiple that low compared with the S&P 500, the author notes.”

Thank you for reading.
Brad Pappas

RMHI Client Letter, March 11, 2023

March 11, 2023

Late last year I noted a sharp difference between the bank deposit yields that Schwab was providing of approximately 0.4% versus short term T-bills of 4% or more. Seeing this interest rate spread I moved the majority of client cash to T- bills at +4% or more rather than let it sit in a Schwab earning almost nothing.

As I’ve mentioned this was a simple choice to make which allowed us to earn interest while the Bear market in stocks and bonds evolved.

Banks and brokers have been negligent in raising money market interest rates to be competitive to short term T-bills because they earn quite a bit of revenue off the spread. They’re able to earn risk free rates in 3-month T-bills at 4% or more while the source of capital (your cash in money markets) earns under 0.5%.

Socially Responsible Investing, Vegan Investing

Previously, outflows from bank interest rates were slow and since there was no urgency banks were slow to raise depositor interest rates.

This lack of urgency changed when the Fed’s interest rate hikes grew meaningfully and investors recognized the interest rate difference.

The chart below shows how higher paying money market.

Socially Responsible Investing, Vegan Investing

As bank deposits decreased dramatically and moved into money markets in the past six months it forced banks to increase their liquidity by selling off other assets to raise capital to meet demand.

This is where the rubber meets the road. Exactly how was the bank investing the client deposits?

This is where SVB got into trouble. There is nothing like a 40-year trend in lower bond yields = higher bond price values to make bankers complacent. SVB invested a very large percentage of depositor assets into long term bonds. In other words the bank too substantial losses due to complacency and a lack of risk control. SVB did not hedge their Treasury bond risk.

Socially Responsible Investing, Vegan Investing

If I were to use the $TLT ETF which holds Treasury bonds in the 20-30 year maturity range as a proxy: The TLT price peaked at $151 in December 2021. Yesterday it traded at $105.

SVB chose not to take the loss by selling and moved the bonds to a “Hold to Maturity” or HTM classification. If they took the loss it would have been reflected in their quarterly earnings reports.

Moving the bonds to HTM reduced the liquidity of the bank to meet day to day business. So, to replace the cash that was moved to the HTM category the bank offered to sell bonds, stocks and preferred to the investment community. Obviously, the offering was rejected and a run on the bank began.

Shares of SCHW were down 11% yesterday and I’m taking particular notice. At this time it does not appear they face the same risk as SVB. So far, SVB looks like an isolated event of risk of poor judgement and lack of risk management.

The decline in share price could come down to two distinct reasons: The long awaited merger with TD Waterhouse could be called off.

Second, the interest rate spread I mentioned earlier is a large source of revenue for Schwab. This is the age of no-commission trading so Schwab had to offset the loss of commission revenues in other ways. Paying next to nothing for deposits was large source of revenue.

Volatility

At present we have roughly 3% exposure to stocks. The balance is a combination of cash, Treasury bills and Municipal bonds. We have very little exposure to risk which allows us to be patient and let this storm blow itself out.

Many times I’ve said that when the Fed starts raising rates “things break”. SVB is case of a “Break” but I expect more to come. The breaks don’t have to come from banks, they can come from anywhere and they can be sudden.

Famous “breaks” are Enron, Worldcom and Madoff. All three emerged during Bear Markets.

For the past year and a half I’ve been very negative for stocks and was unable to embrace the rallies with any enthusiasm. Now, my tune is changing.

I will continue to be patient as there is no need to act right now. But my sense is that at some point (and there could be many points) in 2023 stocks will bottom and offer a great opportunity for those who’ve protected their assets this year.

My focus will be on the highest quality holdings. Major market bear markets are the best time to buy the highest quality stocks. Depressed prices offer a great opportunity to buy into franchises that rarely meaningfully sell off. These are the companies you can hold on to for the long term.

These companies are dominant in their category and frequently have a wide moat (dominant and difficult to compete against).

Examples are:

Monster Beverage
OTC Markets
Accenture
Adobe Systems
Autozone
Cintas
Google
Home Depot
Moody’s
Old Dominion Freight
Mastercard and Visa
Microsoft

We can afford to be patient and sit on our hands waiting for the right time to move. I suspect it will be this year. The time to be negative in the long term is over. Now is time to look for opportunity.

When the stock market rallies, the expected forward return for stocks declines.

When the stock market declines, the expected forward return for stocks rises.

Thank you for reading and being a client.
Brad Pappas

Waiting for the Fat Pitch

Waiting for the Fat Pitch
Feb 2023

For those not familiar: The Fat Pitch is a baseball reference for when a pitcher leaves a pitch flat and over the center of the plate. Meaning, that a pitch in the red zone offers the highest success percentage for a base hit. A disciplined batter will avoid low odds pitches and wait for a pitch right over the plate. No one put this concept more succinctly than Ted Willams.

Socially Responsible Investing, Vegan Investing

For Ted Williams, the orange and especially the red zones were his ideal sweet spot. A spot he rarely missed which is depicted by the batting average inside each circle. In a career if you hit over .300 (a base hit in 30% of your at-bats you might well be in the Hall of Fame. He hit .344 during his career and he is arguably the greatest hitter of all time.

How does this apply to investing? I am waiting for the Fat Pitch aka the pitch in the red zone that has the highest probability of success. It’s expected there will be several tempting entry points for growth in 2023. My effort is to patient and wait for a pitch in the red zone.

For example in the Dot Com bust of 2000 to 2003 the top 5 Bear market rallies in the S&P 500 of 24%, 19%,12%,12% and 11%. But the peak to trough drawdown during the same period was -49%.

In the Great Financial Crisis of 2007 to 2009 the top 5 rallies were 21%, 21%, 21%, 19% and 15%. The peak to trough drawdown during the same period was -56%. 

Investors who chase these interim rallies are swinging at bad pitches with low success rates. Fear or FOMO (Fear of Missing Out) is an important driver for investors who think the markets can’t go lower and “This is the bottom”. 

We remain in a Bear Market

How will we know we are transitioning from Bear to Bull Market or in the example above to Fat Pitches?

  • A series of aggressive interest rate cuts by the Federal Reserve. Lower rates allow stocks be more relatively attractive. Hiking rates makes them less attractive.
  • An obvious recession: No more debates as when, if or how bad will the recession be. It will be obvious especially when the unemployment rate rises.
  • The yield on 9 month Treasury Bill 4.9% and the dividend yield on the S&P 500 1.7%. At present the gap is potentially serious. A recession with falling stock prices would increase the dividend rate for stocks. Plus, the Federal Reserve would lower the Fed Funds rate which would narrow the gap.
  • Finally, the downward slope of the 200-day moving average of the S&P 500 and the NASDAQ reverses to the upside. If there is a single factor that could signal the end of the negative trend in prices it would be a new upward slope of the 200-day moving averages. See the two charts below. Upward and downward slopes have a contrasting binary outcome.

Socially Responsible Investing, Vegan Investing

Upward slope = +7.4% annualized rate of return
Downward slope = -1.6% annualized rate of return

Nasdaq Composite

Upward Slope = 13.1% annualized rate of return
Downward Slope = 0.79% annualized rate of return

Socially Responsible Investing, Vegan Investing

To further define what it means to be buying stocks in a downtrend. Buying into a downtrend forces the investor to be a trader rather than a long term investor. Estimates have shown that over 70% of a stock’s behavior is due to underlying trend of the stock market as a whole. So by my way of thinking buying stocks in a downtrends is swinging at bad pitches.

If I’m completely wrong in my summary there is an exception. All transitions from Bear market to Bull market are confirmed by a trend change in the 200-day moving average. The 200-dma moves into an uptrend by default if stocks continue to show strength long enough.

Recent market strength

Markets view Fed Chair Powell as weak. In other words, they don’t see Powell as having the will to drive inflation into the ground with rate hikes. He’s not former Fed Chair Paul Volker who pushed rates to 20% in March 1980.

Volker at 6’7 with billowing cigar smoke in congressional hearings was the Capo Di Tutti Capi of Fed Chairs. Not to be intimidated by anyone especially Congress. The result of his rate hikes was the recession of 1981. However, his efforts put an end to the inflation of the 1970’s.

The probable cause of the most recent rally is the state of financial conditions which are signaling economic growth by easing financial conditions. 

Socially Responsible Investing, Vegan Investing

is could mean a return of inflation and higher Fed Funds rate. Employment is not showing many signs of weakness which is problematic for the Fed. This could mean there is a future rug pull ahead (the Fed being forced to raise rates higher than expected and turn financial conditions back to the red). 

Source: The Conference Board

The Conference Board Leading Economic Indicators has moved into the recession zone.

Socially Responsible Investing, Vegan Investing

Summary: Absolute Inflation has probably peaked but there can be more peaks in the cycle (from lower levels). Based on the Conference Board LEI we should be in a full bloom recession by mid 2023. 

If the recession is confirmed I could envision another steep decline of 20% to 30%. This would force the Fed to lower the Fed Funds rate and stimulate the economy. It might arguably be the best entry point for stocks in many years.

Any potential entry point until then offers relatively mediocre or poor risk/reward.

So we just wait for the eventual “Fat Pitch”.

Thank you for reading

Brad Pappas
February 6, 2023