October 2018 Client Letter
Client Letter, October 8, 2018
Quick Summary: The end of an era may be at hand. The rally in bond prices that dates back to 1981 appears to be over. I’m not convinced it’s over for good but that’s an argument to be made later on.
In the meantime, falling bond prices represent a headwind for stocks and could remain so until bond prices find a short term floor. This headwind accelerated the decline in stocks on October 4th and 5th. This prompted me to raise cash from holdings that either had losses or were laggard holdings. A portion of cash was used to purchase hedges to offset any future stock price declines.
It’s most likely that this is just a short or intermediate termed decline in stocks as the long term trend remains firmly in place. Part of the purpose of quick market declines is to make investors fearful and uneasy, one reason we use hedges to cushion declines.
Chart 1: This chart below shows that the long term trend to lower interest rates is being threatened. This can’t be a surprise with the rapidly expanding deficits and very low unemployment. But as I’ve highlighted with arrows: it’s not uncommon for interest rates to rise in the latter stages of the business cycle, only to fall hard when the Fed raises rates enough to trigger recession. I don’t see this time as any different. My best guess is the current bond weakness is a future buying opportunity later in 2019.
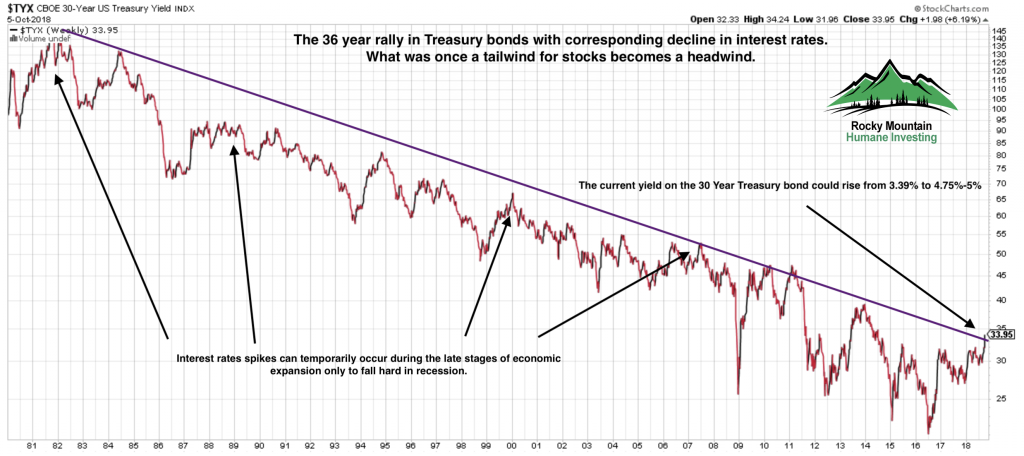
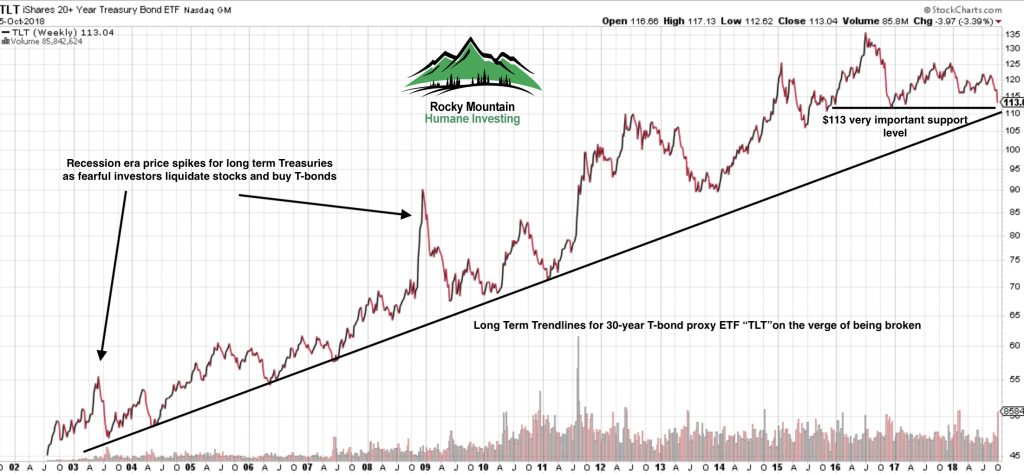
Chart 2: Proxy for the 30-Year T-bond is the TLT. The chart below is inverse to Chart 1 above. Any further weakness with a close below $113 could accelerate the bond sell-off which would trigger more stock market weakness in the short term.
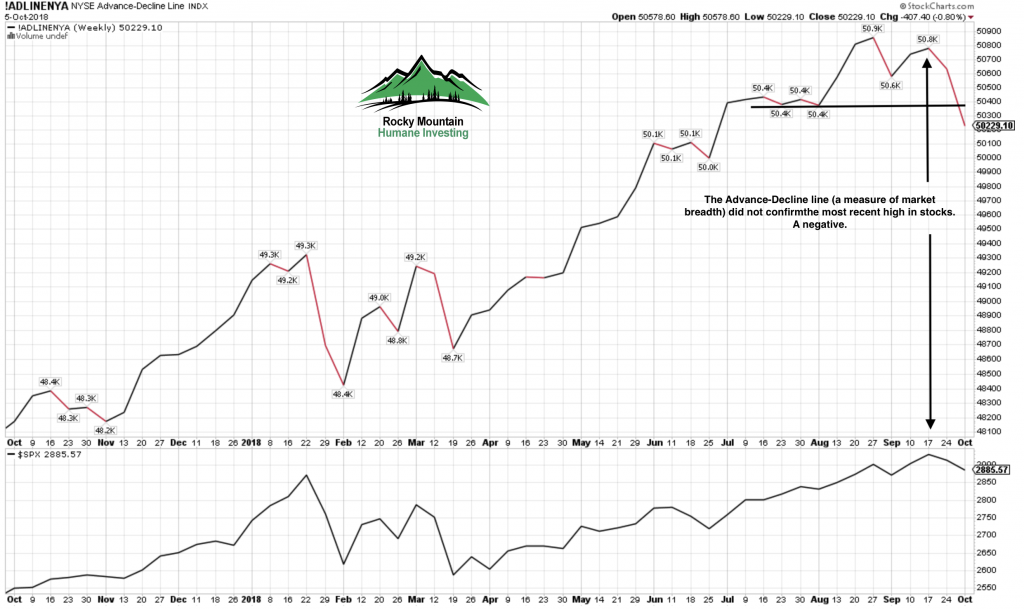
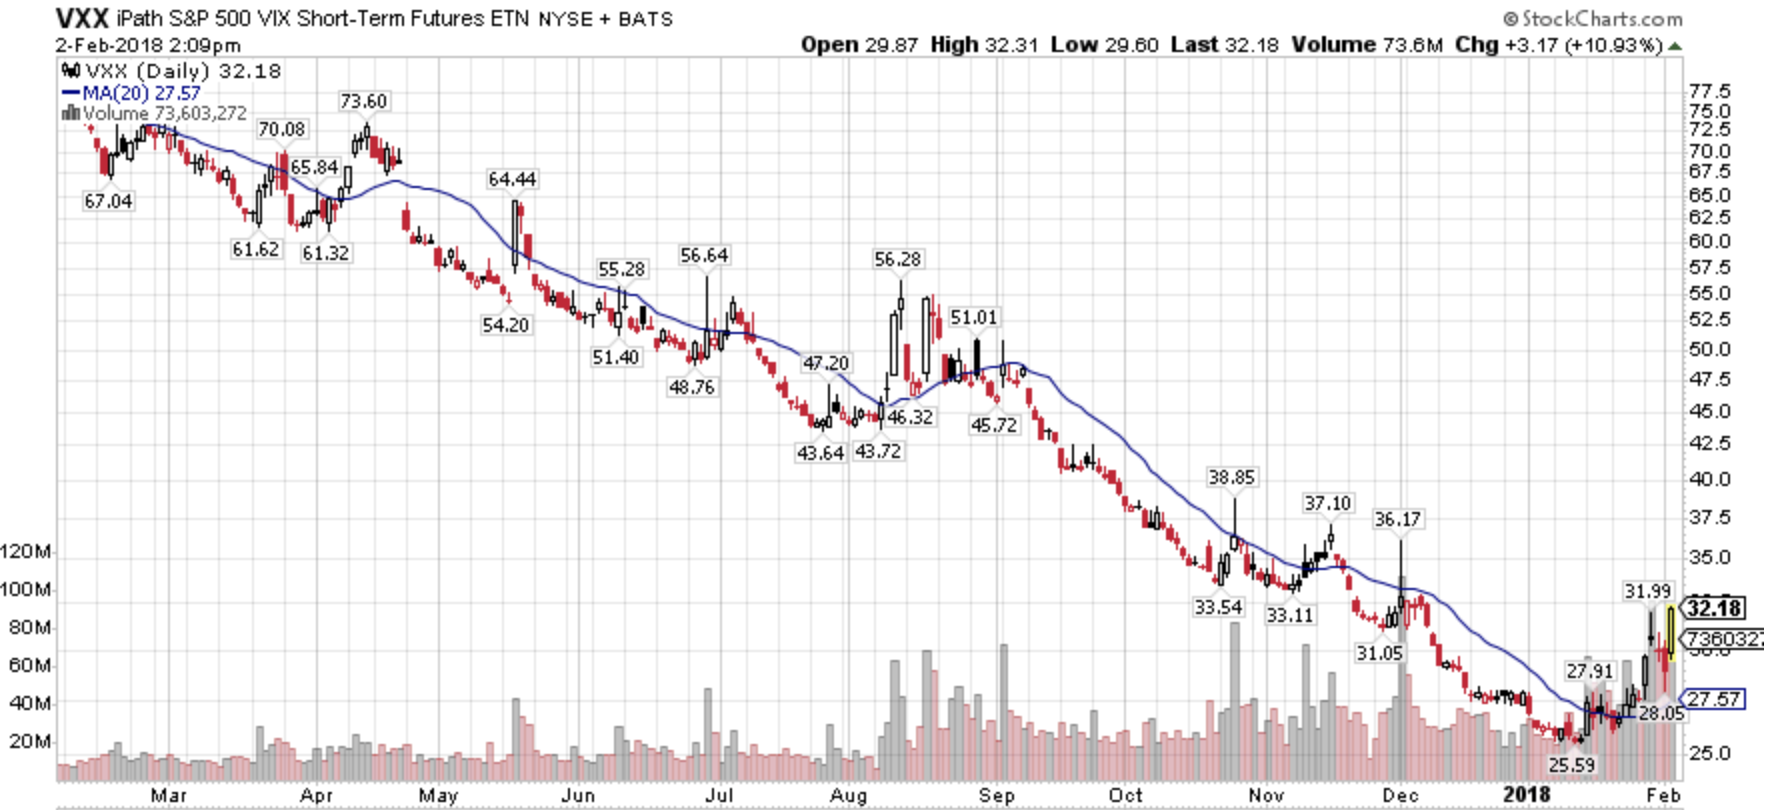
Chart 3: A direct beneficiary of the decline in bond prices is setting itself up for a very good risk/reward trade. As the bond market declines, the TBT will rally higher.
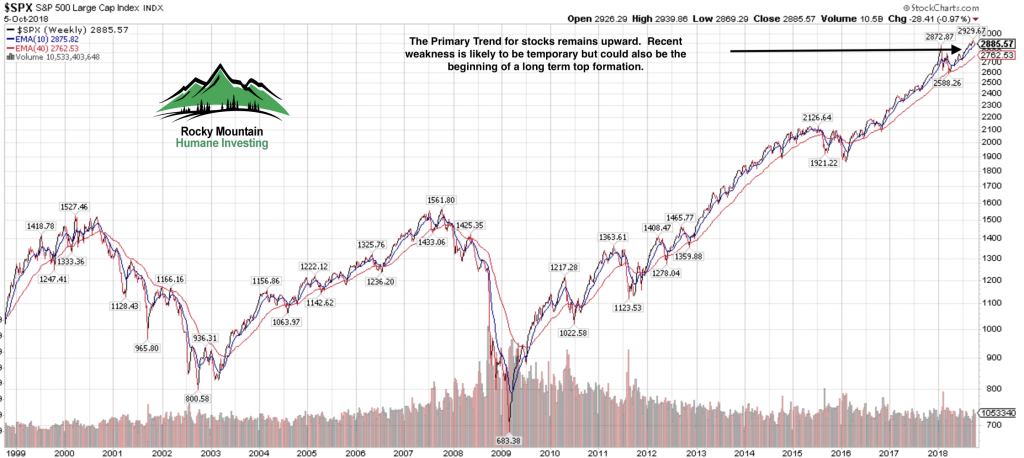
Chart 4: Internal market strength was showing an important discrepancy with the Advance/Decline line which did not confirm the most recent market peak as it should. This non-confirmation gives us a clue that internally at present the stock market is not very healthy and is in need of a purge.
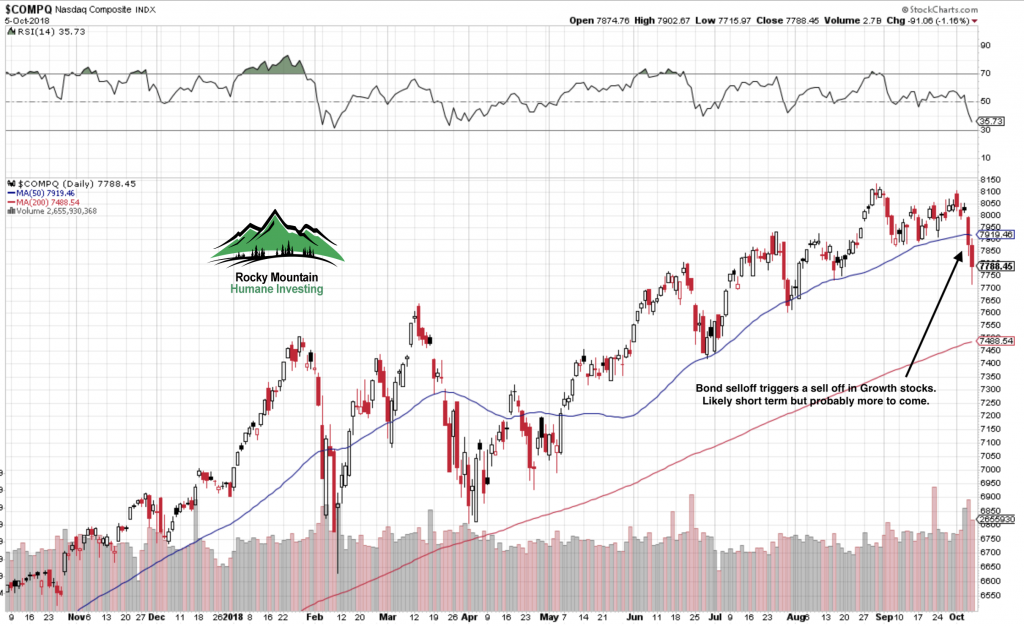
My guess is that the selling is not finished. We may bounce here for a day or two, but if the bond market continues to be weak, the Nasdaq Composite (Chart 5) could visit 7500 or so quickly. Selling would likely be contained at that level. Odds are high this is not the start of a bear market for stocks.
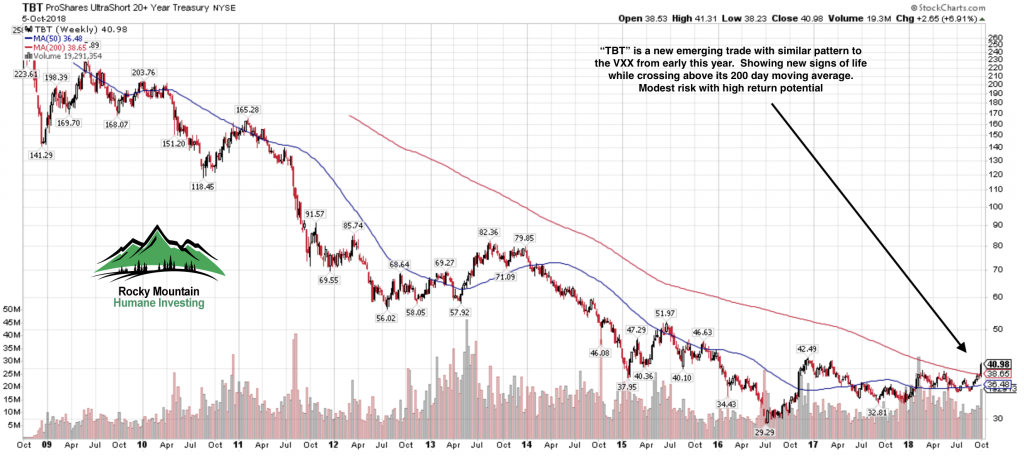
Chart 6: Our long term primary trend indicator remains quite positive at present. Market tops are usually made by a rolling-over process rather than a mountain top peak. See my estimates for business cycle – stock market peak below.
Parlor game guesses for cycle peaks
Based on the Fed’s rate hike projections, we’ll reach inversion by February 2019. The Fed has given no signal to indicate they’ll declare a halt to rate hikes which could push the date to later next year. In fact the most recent jobs data makes me think they’ll hit the brakes hard next year.
So, based on an inversion in February 2019 we can make some recession date assumptions based on the past 9 yield curve inversions dating back to 1957:
The shortest lead time from inversion to recession has been 8 months: October 2019. Median lead time from inversion to recession has been 12 months: February 2020.
Longest lead time from inversion to recession has been 20 months: October 2020.
Understand the recession data is based on NBER declared recessions and they date the start of a recession many months in hindsight. But we can make reasonable estimates based on yield curve inversion dates.
The stock market is a forward looking barometer meaning that the markets look ahead into the future. This means the US stock market will peak and begin to rollover before the recession starts.
Based upon data from 1957, the US stock market has peaked on average 5 months before the start of a recession.
Earliest estimated stock market peak is May 2019. Likeliest estimated stock market peak is September 2019. Latest estimated stock market peak is May 2020.
Thanks again to all of you for your trust. As an investment manager, my goal is to avoid the dogmatic approach, be flexible and neutral to market behavior. Any investor who decides to get into an argument and mansplain to the market will emerged bruised and poorer for the experience.
All the best,
Brad Pappas
![IMG_0670[1]](http://dev.www.greeninvestment.com/wp-content/uploads/2013/08/IMG_06701.jpg)

