Vegan Growth Portfolio Model results updated through September 30, 2018
We’ve updated our Vegan Growth Portfolio model results with the data through September 30.
We’ve updated our Vegan Growth Portfolio model results with the data through September 30.
Since the 10% decline in the S&P 500 index in late January I’ve been using my Bull Market playbook to deal with a decline. Technically speaking we are still in a Bull Market but our Bull status is looking more precarious by the day. The Bull Market playbook means I’m looking for a double bottom or retest of the market lows off the initial sell-off. Secondly, I’d be looking to buy stocks on signs of a successful retest and rally.
Friday’s 2.19% decline was especially disheartening since it wiped out three days of gains. Stocks had been showing signs of recovery by trying to build a base from which to rally. Previously, markets were appeased by the story that the White House was using the tariff threats as a negotiating tool. But Friday’s news showed that markets are not buying that story any more. This is a dangerous and unpredictable situation that leaves any investor unhedged in stocks vulnerable to policy mistakes and reckless statements from the White House or cabinet.
The second leg down rallies have been relatively weak with reduced volume while declines have been larger in magnitude and increased volume (not good). This reveals that large institutional investors are in a liquidation mode and are using rallies to sell rather than using declines to accumulate. This is Bear Market behavior and is giving me pause to reassess the likelihood of another another significant leg down for stocks and the possibility of a Bear Market.
Perhaps this weakness is the aftermath of the parabolic rise in stocks earlier this year? Plus the extreme readings of investor sentiment? It’s possible, but I’d argue that stocks and bonds are now reacting accordingly to an aggressive Federal Reserve and a much higher than average possibility of policy mistakes from the White House.
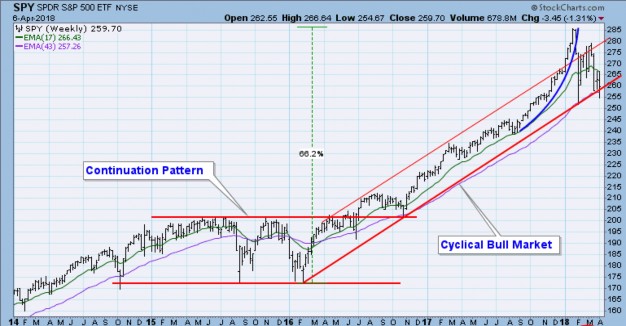
Chart 1 above, courtesy of Carl Swenlin of Decisionpoint, shows the importance of the $257 level for the “SPY” aka S&P 500 ETF. Both the 200 day moving average and the underlying trend line from the 2016 rally converge at nearly the same level.
There are also other important issues the world stock markets are contending with:
The global economic recovery is mature and slowing. Worldwide GDP data is showing clear signs of slowing.
Policy Errors: The tax cuts are the personification of fiscal irresponsibility and there’s no going back.
Trade Wars are “good and easy to win”. Investors aren’t fooled in the least by this rhetoric (see Smoot-Hawley Tariff Act). We’ve never had a President who can just as easily talk up a stock market and talk it down with rhetoric within weeks. This is certainly a market headwind for stocks.
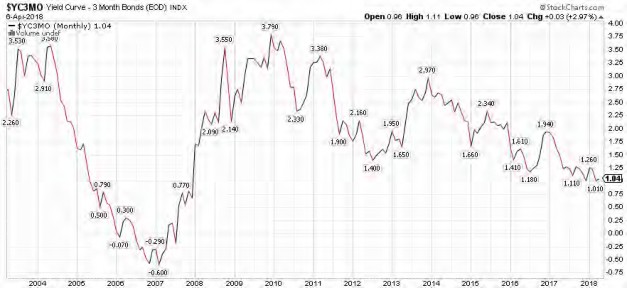
Aggressive Federal Reserve: The “Yield Curve” (shown above in Chart 2) is growing increasingly negative as short term interest rates are rising which will eventually kill the economic expansion. This causes investors to buy long term Treasury bonds. The higher short term yields and lower long term yield flatten the difference between short and long term rates which reduces the incentive for banks to lend.
The Yield Curve is a simple indicator and one of the most powerful tools to predict markets and the economy. Once the curve drops to .5 its “Goodnight Irene” for stocks and “Good Day Sunshine” for Treasury bonds. This is why we’ve recently added long term Treasury bonds to client portfolios.
If you’d like to learn more about the Yield Curve, there is an array of data from none other than the Federal Reserve:
https://www.clevelandfed.org/our-research/indicators-and-data/yield-curve- and-gdp-growth.aspx
Our Present Status: A sharp break in the price in Chart 1 below $257 without a rebound implies there is more selling ahead, which could be significant. Since my style of investing is based on reacting rather than predicting, I’d look for a $257 break to increase our existing hedges and further reduce stock holdings.
Should the price break below $257 not occur or occur briefly, I’d keep the status quo but expect the bottoming process to take longer than expected. I’d likely prefer to reduce stock holdings in strength until we see a positive change in market behavior.
Treasury bonds: My W.A.G. for Treasury Bonds and the economy is that the Yield Curve inverts in 2019 which will cause a full blown bear market in stocks and bull market in Treasury bonds. T-bonds could rally by more than 20% due to the reduced effect of lowering interest rates in an already low rate environment by the Fed. This could be followed by recession and bear market low by 2020.
Bottom Line: I’m agnostic to market direction as we can generate profits in accounts regardless of market trends. It’s the transition periods which we are possibly in that are tricky to assess. Once a new trend emerges, be it up or down, I’ll adapt and do my best to continue generating profits on your behalf.
Thank you,
Brad Pappas
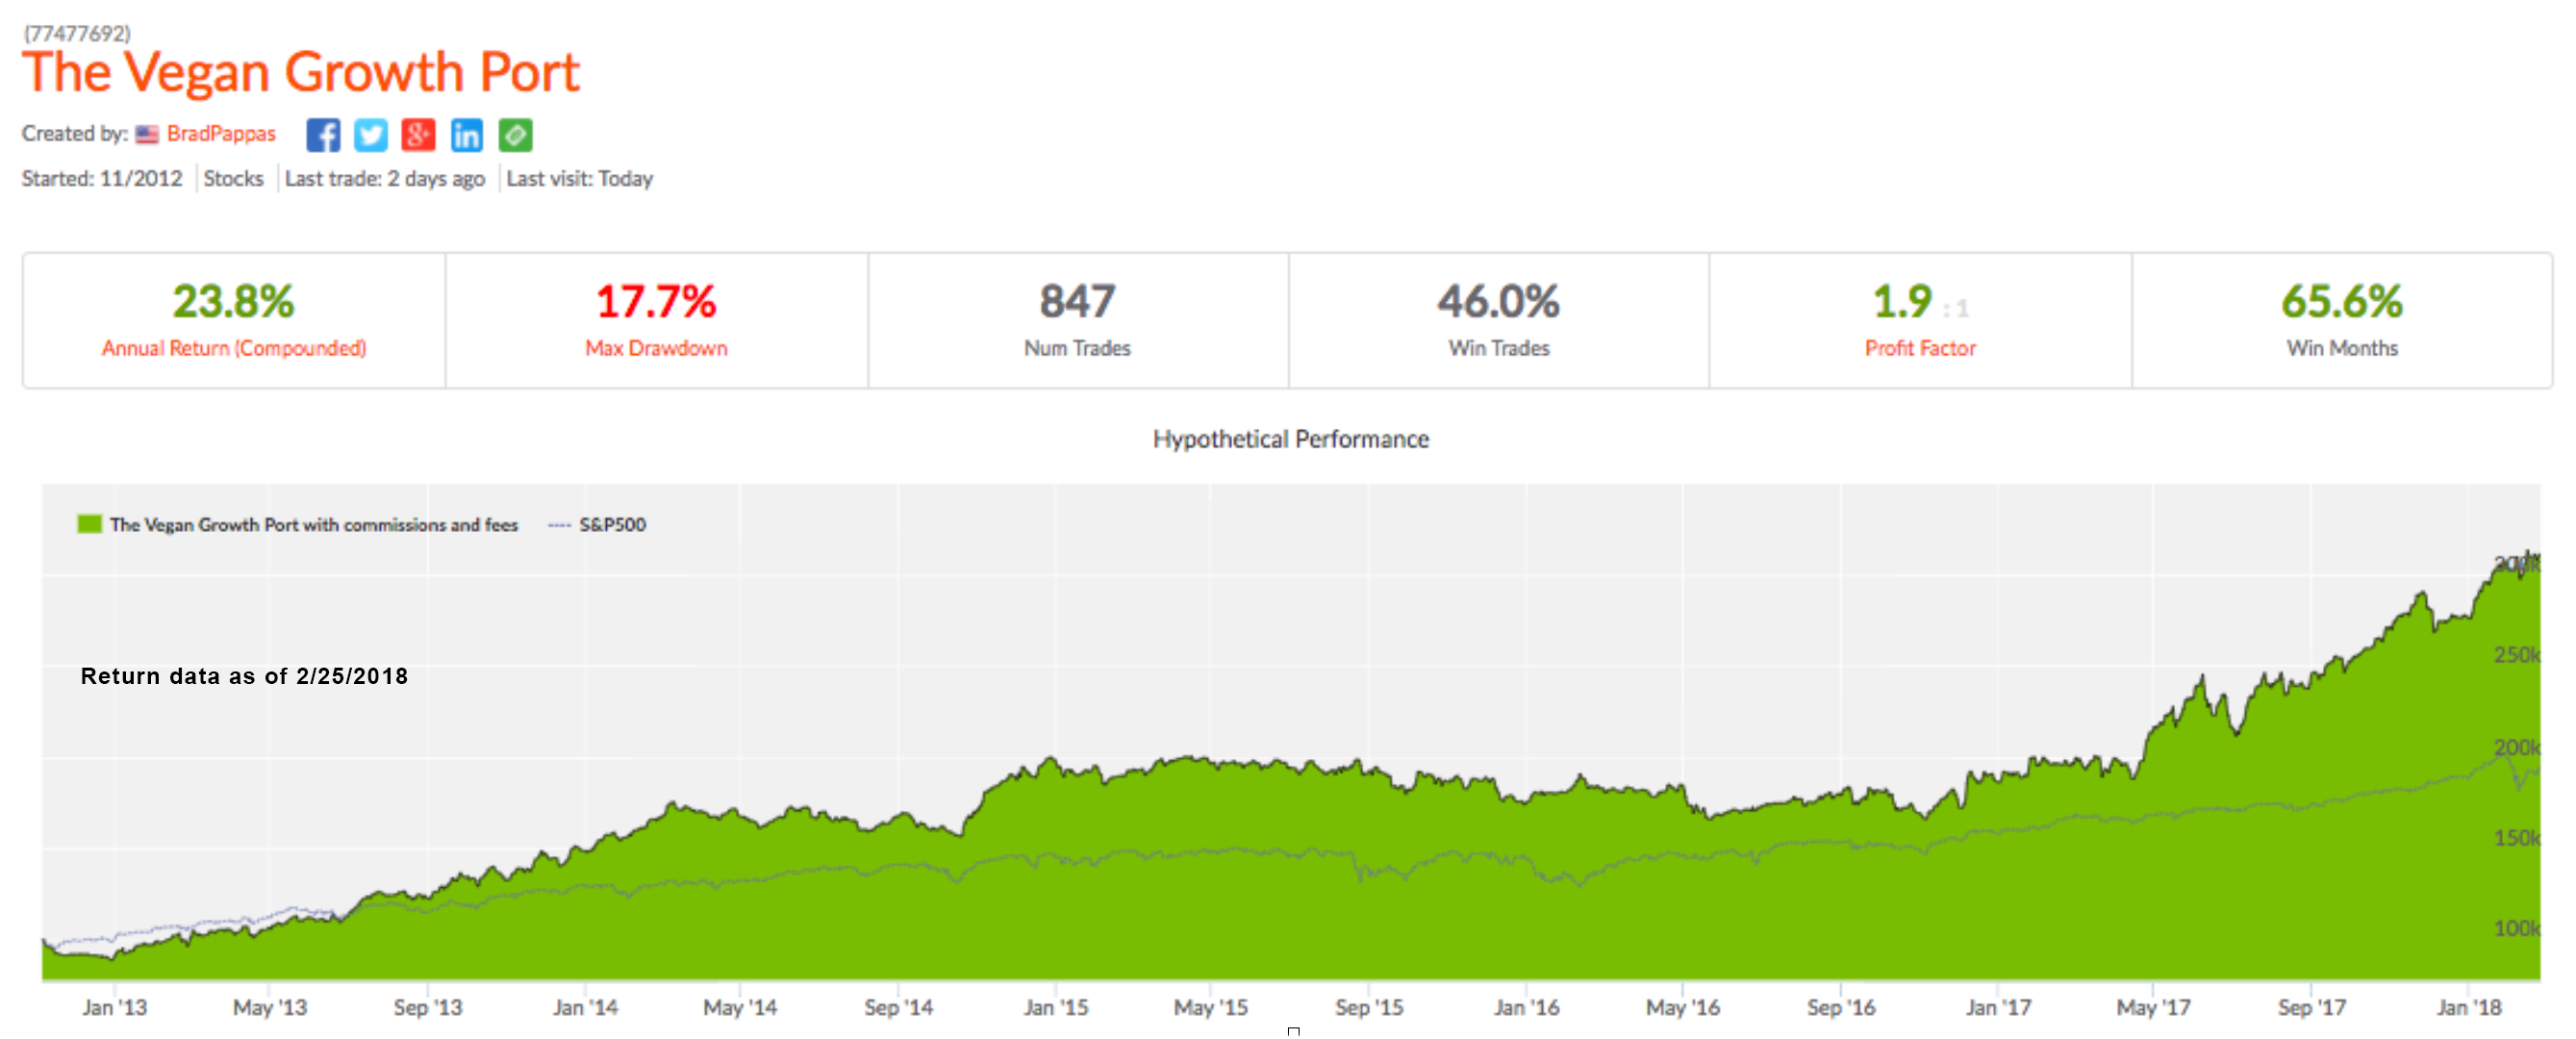
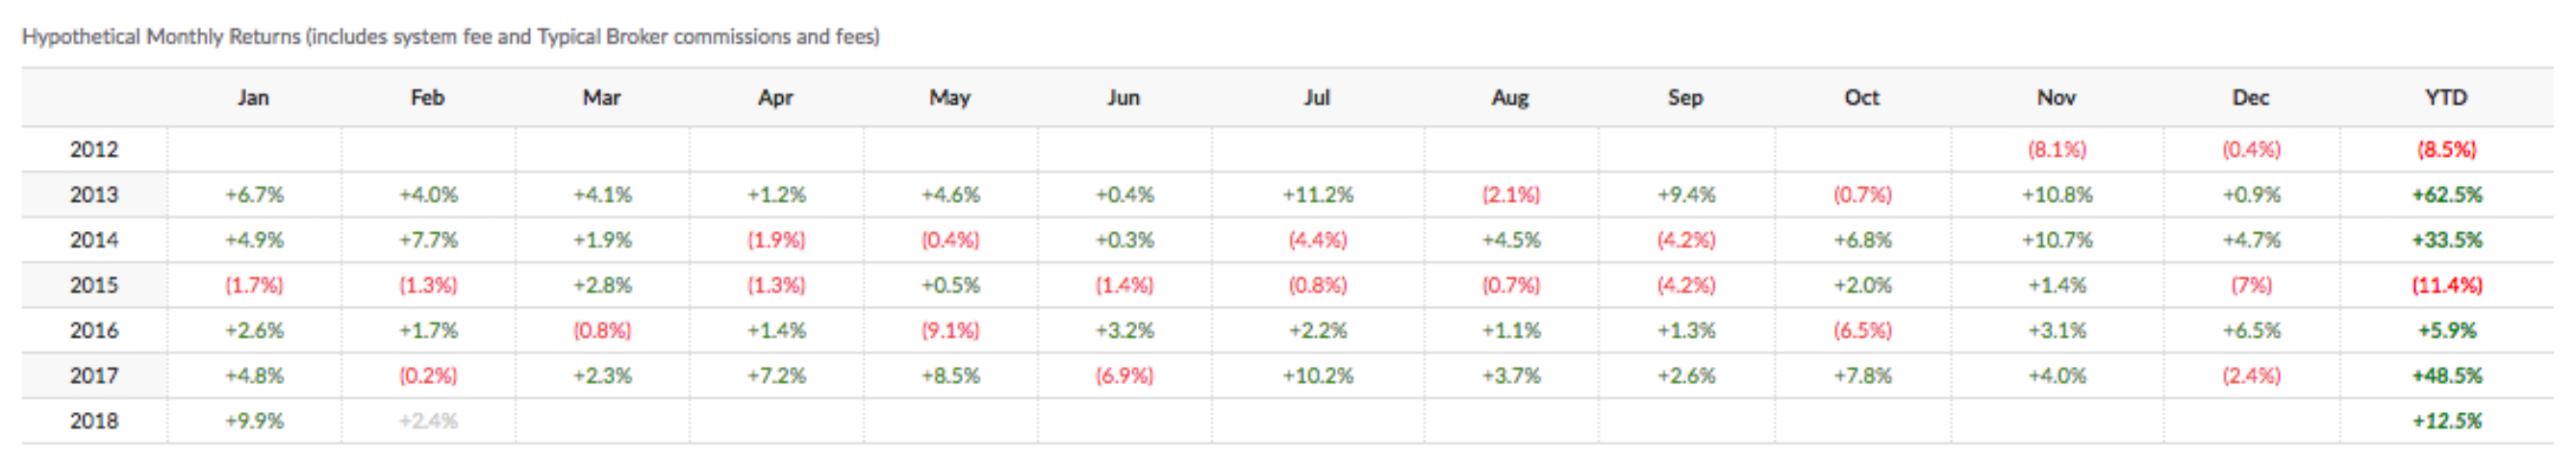
We’ve updated our Vegan Growth Portfolio model results with the data through March 30. So far, VGP is well ahead of the S&P 500.
It has certainly been a wild three weeks after a peak to trough -11.8% decline in the S&P 500.
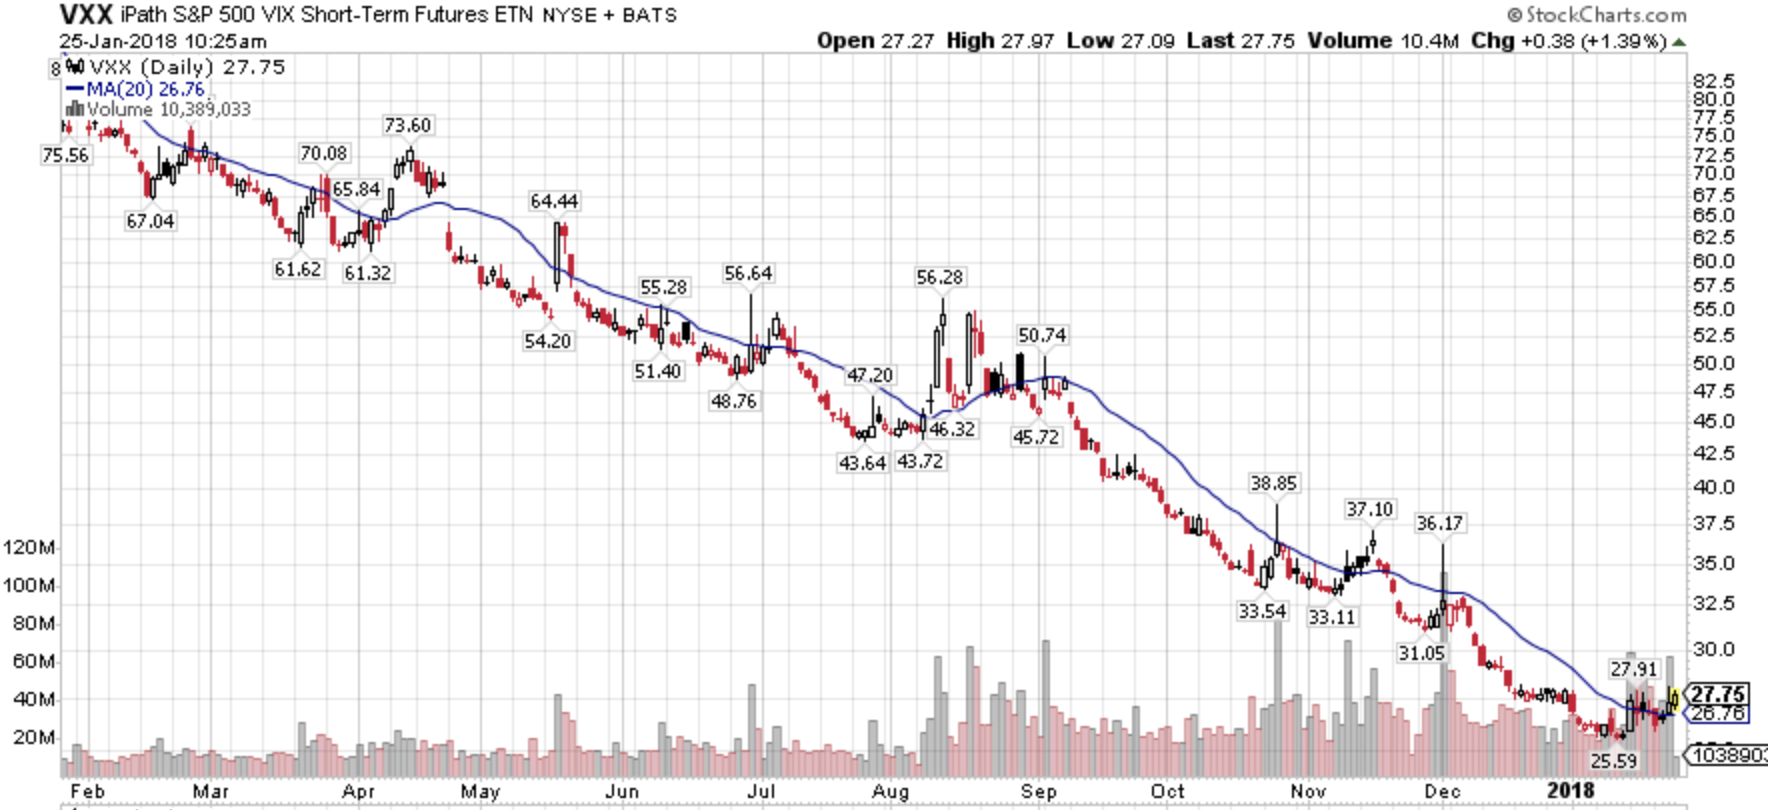
As we’ve been saying in our blog https://www.greeninvestment.com/blog/, during January we were trying to factor in the effect of emerging strength in the VXX along with rising interest rates due to a weak bond market. If you add to this a parabolic move in US equities, I felt that stocks could sell off sharply, which they did.
For our clients (which is reflected in our collective2.com model portfolio), we sold off approximately 40% of our equity holdings and added a 10% “hedge” by buying the emerging VXX to offset potential stock market losses should the decline occur. The downside to adding a suitable hedge to a portfolio is: should the market continue to rise any gains would be relatively muted or non-existent. I consider that a small price to pay to reduce potential risk and volatility.
To quote super investor Paul Tudor Jones: “The most important rule of trading is to play great defense, not offense.”
Client portfolios held their value and the Vegan Growth Portfolio model shows a positive gain for the year of 12.5% (net of all fees and expenses) versus 1.5% for the S&P 500.
A good advisor or investment manager should be paying attention to the many moving parts that could affect their client portfolios. In this instance, we were able to successfully anticipate the sell-off. That won’t always be the case and sometimes we’ll be wrong as well. I think it’s critically important for the long term success of our clients to act when we think the odds are good that we’re entering a high risk period.
Cheers,
Brad Pappas
President, RMHI
Brad@greeninvestment.com
970-222-2592
The information provided here is for general informational purposes only and should not be considered an individualized recommendation or personalized investment advice. The investment strategies mentioned here may not be suitable for everyone. Each investor needs to review an investment strategy for his or her own particular situation before making any investment decision. All expressions of opinion are subject to change without notice in reaction to shifting market, economic or political conditions. Data contained herein from third party providers is obtained from what are considered reliable sources. However, its accuracy, completeness or reliability cannot be guaranteed. Past performance is no guarantee of future results.
Volatility ETN’s like VXX appear to at least be putting in a short term bottom. Eventually Volatility will increase and the VXX could rise substantially. Long VXX.