The quote is from Oscar Wilde from The importance of Being Earnest but also defines the tension of what the Fed will do and when will they do it.
Long term lead indicators are stretching their tentacles into Mid Summer 2015 and foresee neither business cycle peak nor recession but we will be in the zone where the Fed may decide to begin to normalize short term interest rates. Of course they could do absolutely nothing next Summer but we do see from the Fed meeting minutes that rate hike hawks are growing in number. In the meantime its safe to assume that a benign, low to zero interest rate policy will remain in effect which is positive for equities.
ECB President Mario Draghi affirms that European central banks will maintain very low interest rates for very long time and may introduce their own version of Quantitative Easing. So, we will have two of the largest central banks at 0% interest rates for at least the next 6 months, and probably more.
With this backdrop we remain fully invested in equities having deployed the last of our remaining cash during the small pullback earlier this month. The path of least resistance for equities remains higher.
We remain in the slow season for equities but in just over a month’s time this will be ending and we’ll be in the market’s happy zone from October thru March where the majority of the year’s gains can be made.
Brad Pappas
Under normal conditions I’m decidedly positive or negatives regarding US equities. While I’m positive in the longer term time frame (one year) I remain cautious in the shorter time frames. My prime reason for caution in the short to medium term is the declining number of stocks making new highs.
In general, when we see the number of new highs in the S&P 500 index declining we can assume that the rally is very mature and a cautious posture is prescribed. Likewise if we see an increase in the number of stocks making new lows we can safely assume that there is internal erosion occurring even if the major market indices show little or no weakness.
Our quandary today is that we do see a reduction in the number of new highs, the top coinciding with the peak in investor enthusiasm in December. But we are not seeing an increase in the number of new lows.
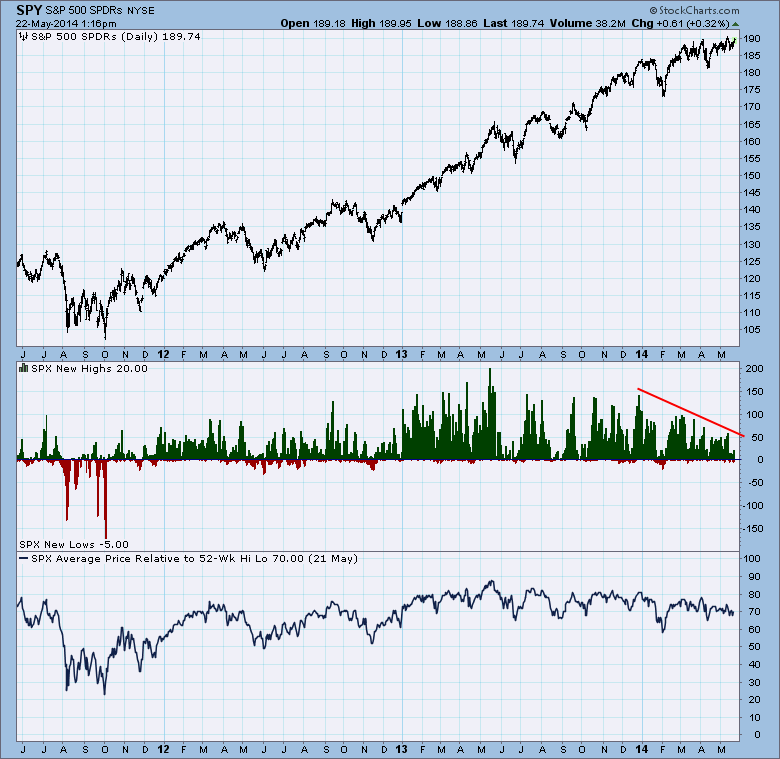
Due to the erosion in the number of stocks making new highs in the SPX we’re sticking to a neutral posture for the time being while reserving enough cash on the side to hedge our long positions should the SPX break to the downside.
Be careful out there
Brad
No positions
“The Stock Market” is a term that implies a single uniform investment forum that rises or falls as a cohesive index. In reality, especially in 2014 nothing could be farther from the truth.
The homogeneous “stock market” has fragmented itself down into several divergent personalities. If you own a portfolio, mutual fund or an index fund that tracks the S&P 500 you’re probably blase regarding 2014 performance. But if you’ve been investing in small stocks and not paying attention your account statement will tell another story.
Small stocks otherwise known as “Small Caps” have now given back all of their 2013 excess return over the S&P 500. The small cap stock market or proxy symbol “IWM” has been on a terrific performance streak since 2000 but as we have been saying since late 2013, the streak could be coming to an end.

As of May 21, 2015 the small cap market as depicted by the IWM has given back all of its excess return versus the S&P 500. In other words, unless you cashed out of small stocks when enthusiasm was rampant, you’ve given back all of your excess returns (Alpha).

So we really only get half credit for predicting severe market weakness commencing in the April/May period. The small cap market has crumbled as expected and based on my experience in bear markets I do not believe the weakness is over yet. Meanwhile the large cap based S&P 500 Index is defiantly stable and has yet to roll over.
Anticipating your question here: “Is there a past precedent for this market behavior?” There are only a couple of instances in the past 30 years and they happened near market peaks which were caused by tightening monetary policy which lead to recessions. At present we are no where near a new round of tight monetary policy, nor do we see a recession in sight.
Confusion right now would be justified. We shifted out of the majority of small caps by the end of March and have since redeployed approximately half our client assets into mid and large cap stocks. We prefer to remain just 50% invested which will allow us to hedge if need be.
Since the Fed has no interest in tightening credit and with no recession in sight its quite possible that the S&P 500 will emerge as the new leading market index. Not only that its just as possible that the S&P 500 just drifts sideways over the course of this Spring and Summer, its just too difficult to make a high probability call.
Not a market for investors, but remains a great trading market for balancing risk with the use of SQQQ and TZA. We’ve just closed out this latest round of hedging and will watch and wait for a bounce to emerge in the indices before we’ll likely have another go round with our hedges.
The markets are being led down by the Nasdaq and Small Caps which were the leaders in 2013 but I do wonder how long the S&P 500 can hold up. The strength in large caps is promising as we suspect that mid and large caps will emerge as the new leadership.
As a reflection of our anticipation of mid and large cap dominance going forward we continue to liquidate what few small caps we have. While we have no intention of abandoning small caps completely they will be a much smaller percentage of assets going forward.
With thanks to our development partners in London we will begin to slowly integrate our mid and large cap systems into specific client portfolios during future market weakness. Our first and so far only addition was made this morning with purchases of Automated Data Processing ADP.
Be careful out there
Brad
Long ADP
This may not be a good market for investors but its a fine one for traders. Over the past months we have maintained a cautious tone with the expectation of a potential April top for US equities. While we don’t expect anything dramatic in terms of a sell-off, the selling could be substantial at times as the markets begin to flush out newbie momentum investors or those who need a refresher course in market risk.
As for this being a fine time for nimble traders, this has been the case especially in the Nasdaq and small cap sectors as identified by symbols QQQ and IWM, both of which have rolled over and are leading on the downside. We’ve been able (so far) to capitalize on the the weakness by trading the SQQQ and the TZA as both markets appear to be in a “two steps down and one step up” mode.
Eventually this period will pass and fear will be reinstated as a common investor emotion which will probably lead to a strong second half of 2014. At present, we see no signs of recession and weak markets within growing economies can happen but they’re typically shallower and briefer than recession based bear markets. So, assuming the markets remain with a downward bias into the Summer, this will likely lead to an excellent entry point later this year.
Notice the divergence between the stodgy S&P 500 and the NASDAQ and IWM. This kind of behavior leads me to suspect that the outpeformance in the small caps may potentially be over which is one why we’re expecting to lean heavily on Mid Caps when we eventually move to fully invested.

So far we have avoided shorting the SPY via inverse exchanged traded funds, we’re respecting the market strength.

We continue to opportunistically trade the SQQQ, the inverse QQQ ETF as this market shows a bearish trend. I’d expect to sell the SQQQ in the event the QQQ revisits $84.

We are trading the TZA which is an inverse exchange traded fund that mirrors the IWM which is a proxy for the small cap stock market. We expect to sell the TZA if the IWM moves below $111.
To sum it up: For the time being, this is not a market for investors but for traders. This too shall pass.
Brad Pappas
Long TZA and SQQQ
RMHI and OP clients are very well positioned in light of the falling stock prices in the US and abroad, especially in emerging markets (EM).
As mentioned previously we thought risk could happen fast once the new year was upon us but even I’m surprised by the ripple effects of the FOMC’s taper decisions. We had not anticipated that it would throw the emerging markets (Brazil, Russia, China and Asia, India, Turkey, New Zealand) into turmoil. Turkey, New Zealand, India and Brazil all have central banks that are raising interest rates sharply to stabilize their currencies, which will penalize their growth longer term. If we add a slowing growth rate in China, it only compounds the problems. This is a very bearish environment for EM stocks.
At the start of the year the consensus was that interest rates would rise. We took the other side of that argument thinking that the consensus would be wrong…and were they ever. Who would have thought as recently as 10 days ago that not only were rates not going to rise but that the EM banks would be tightening credit and with investors fleeing stocks and turning to Treasury bonds we’d have a full scale rally in Treasury Bonds?
As it stands as of today 1/29/2014 our largest 5 holdings are:
1. Direxion ETF Emerging Markets 3x Bear symbol “EDZ”: This exchange traded fund or ETF will rise in price if the Ishares Emerging Markets Index “EEM” falls. My thought was that the EDZ would be a much better hedge against any residual stock positions we retain since the emerging markets is facing a real threat while the US is merely experiencing slowing growth. In other words I felt there was a better chance the EDZ could rise sharply than a US based inverse ETF.
2. Pimco Municipal Income Fund “PMF”: stable and wonderfully boring in a volatile world with a locked in 7% tax free yield based on our purchase prices.
3. Nuveen Enhanced Municipal Fund “NEV: see above for PMF
4. Blackrock Municipal Income Trust “BFK”: see PMF and EIV
5. Direxion 20+ Year Treasury Bull 3x: “TMF” This is a leverage ETF we bought a few weeks ago when we started to see an emerging rally in 20 and 30 year Treasuries which was based on the extreme negative sentiment regarding bonds at the end of the year. So far, so good. With the worlds economies slowing and markets retreating T-bonds are a logical place for investors who want a safe haven.
Long all positions mentioned.
Be careful out there,
Brad Pappas